| Param | Original file | Final file |
|---|---|---|
| Filename | modeM0/AS1A09_138T04_9000005282_37073cztM0_level2.evt | modeM0/AS1A09_138T04_9000005282_37073cztM0_level2_quad_clean.evt |
| Size (bytes) | 437,463,360 | 51,834,240 |
| Size | 417.2 MB | 49.4 MB |
| Events in quadrant A | 2,829,938 | 314,610 |
| Events in quadrant B | 3,027,420 | 317,003 |
| Events in quadrant C | 2,871,125 | 301,896 |
| Events in quadrant D | 4,180,054 | 284,227 |
| Mode SS | |||
|---|---|---|---|
| Quadrant | BADHDUFLAG | Total packets | Discarded packets |
| A | 0 | 104 | 0 |
| B | 0 | 104 | 0 |
| C | 0 | 104 | 0 |
| D | 0 | 104 | 0 |
| Mode M0 | |||
|---|---|---|---|
| Quadrant | BADHDUFLAG | Total packets | Discarded packets |
| A | 0 | 11337 | 3 |
| B | 0 | 12062 | 2 |
| C | 0 | 11253 | 2 |
| D | 0 | 15807 | 2 |
| Mode M9 | |||
|---|---|---|---|
| Quadrant | BADHDUFLAG | Total packets | Discarded packets |
| A | 0 | 21 | 0 |
| B | 0 | 21 | 0 |
| C | 0 | 21 | 0 |
| D | 0 | 21 | 0 |
| Quadrant | Total seconds | Saturated seconds | Saturation percentage |
|---|---|---|---|
| A | 5005 | 23 | 0.459540% |
| B | 5005 | 66 | 1.318681% |
| C | 5005 | 90 | 1.798202% |
| D | 5006 | 204 | 4.075110% |
Noise dominated data is calculated using 1-second bins in cleaned event files. If a bin has >2000 counts, and if more than 50% of those come from <1% of pixels, then it is considered to be noise-dominated and hence unusable.
| Quadrant | # 1 sec bins | Bins with >0 counts | Bins with >2000 counts | High rate bins dominated by noise | Noise dominated (total time) | Noise dominated (detector-on time) | Marked lightcurve |
|---|---|---|---|---|---|---|---|
| A | 7158 | 5006 | 4 | 4 | 0.06% | 0.08% | 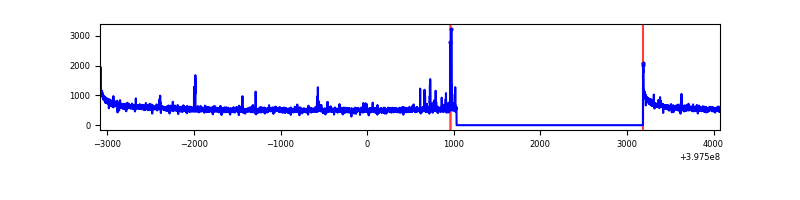 |
| B | 7158 | 5006 | 34 | 34 | 0.47% | 0.68% | 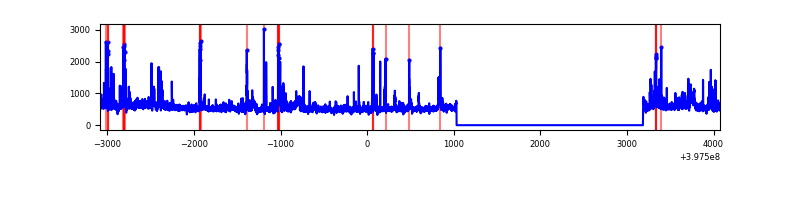 |
| C | 7158 | 5006 | 60 | 60 | 0.84% | 1.20% | 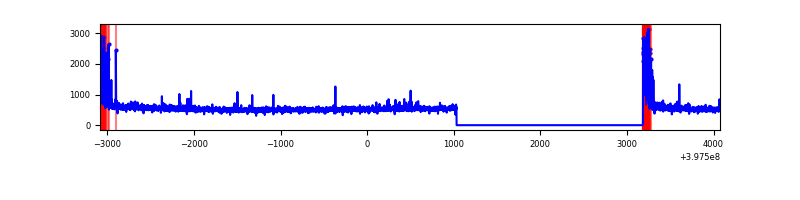 |
| D | 7159 | 5007 | 185 | 185 | 2.58% | 3.69% | 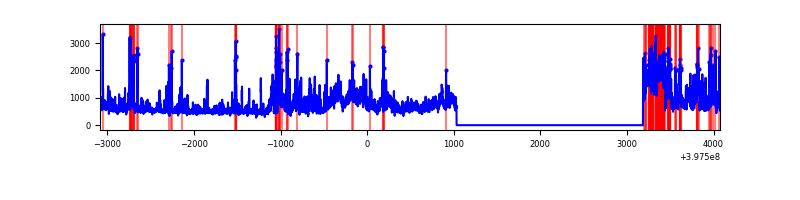 |
Top three noisy pixels from each quadrant. If the there are fewer than three noisy pixels in the level2.evt file, extra rows are filled as -1
| Pixel properties | Quadrant properties | ||||||
|---|---|---|---|---|---|---|---|
| Quadrant | DetID | PixID | Counts | Sigma | Mean | Median | Sigma |
| A | 10 | 83 | 261826 | 2014.63 | 646 | 636 | 129.6 |
| A | 7 | 3 | 33554 | 253.91 | 646 | 636 | 129.6 |
| A | 9 | 143 | 26007 | 195.69 | 646 | 636 | 129.6 |
| B | 5 | 172 | 248124 | 2062.65 | 639 | 626 | 120.0 |
| B | 0 | 229 | 153474 | 1273.84 | 639 | 626 | 120.0 |
| B | 5 | 255 | 57978 | 477.97 | 639 | 626 | 120.0 |
| C | 0 | 10 | 222352 | 1573.05 | 612 | 619 | 141.0 |
| C | 15 | 214 | 211027 | 1492.7 | 612 | 619 | 141.0 |
| C | 0 | 207 | 33859 | 235.82 | 612 | 619 | 141.0 |
| D | 6 | 112 | 1116637 | 7547.87 | 614 | 600 | 147.9 |
| D | 1 | 52 | 271119 | 1829.55 | 614 | 600 | 147.9 |
| D | 1 | 47 | 104338 | 701.59 | 614 | 600 | 147.9 |
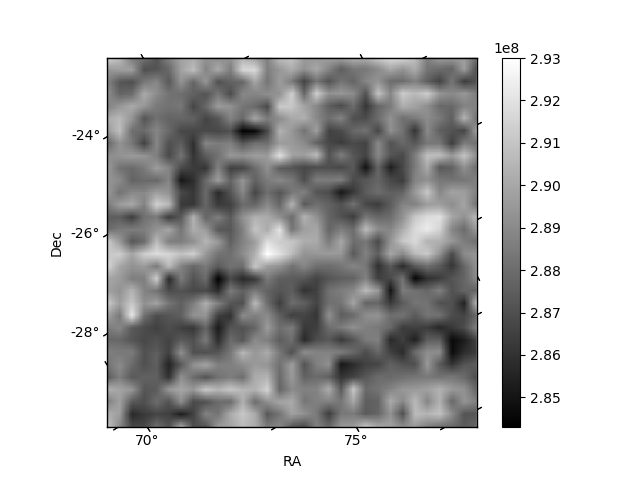
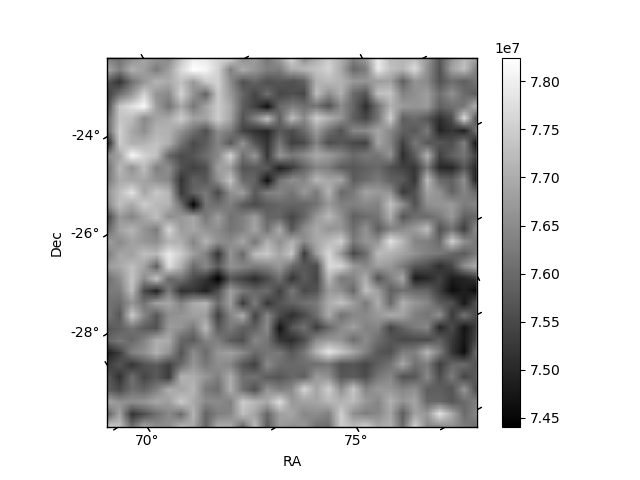
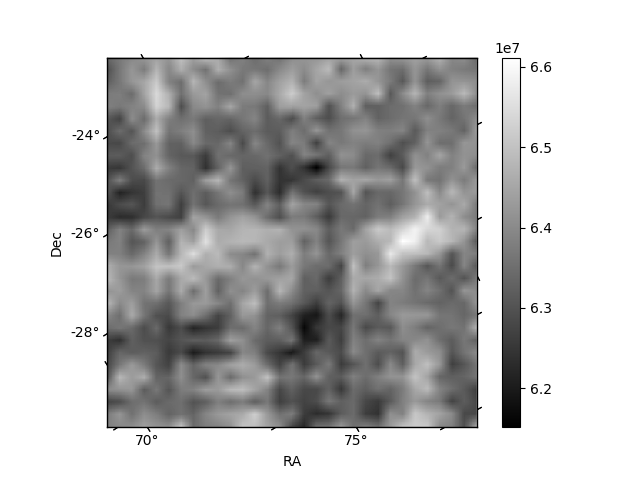
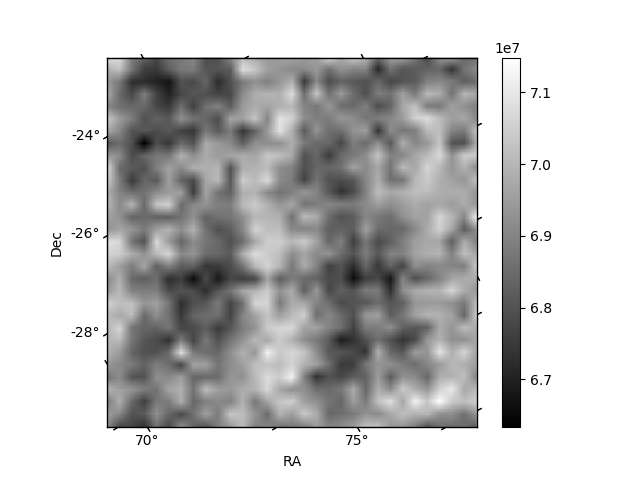
Histogram calculated using DETX and DETY for each event in the final _common_clean file
| Quadrant A | 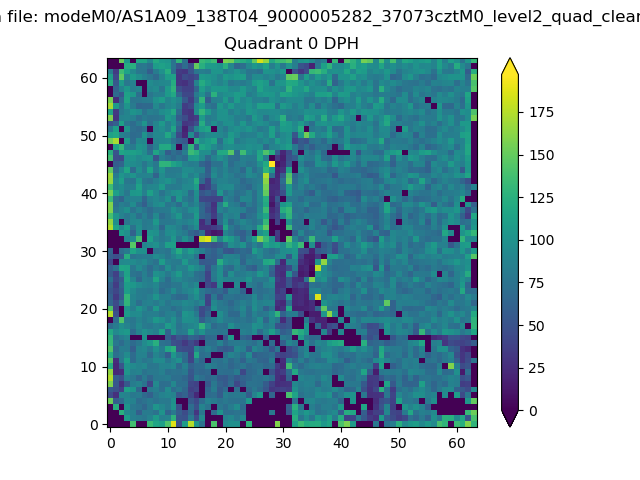 |
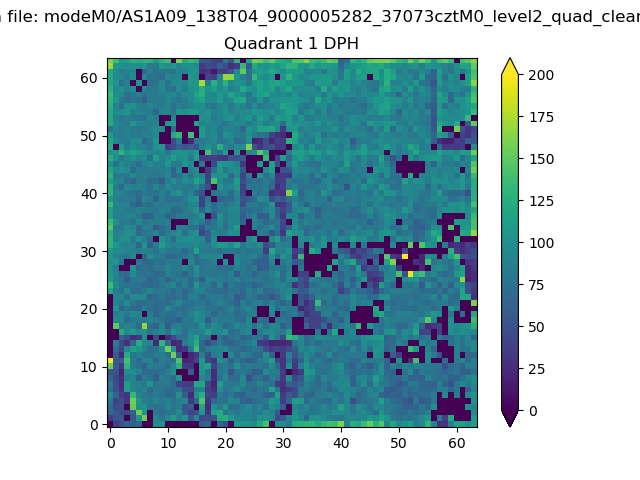 |
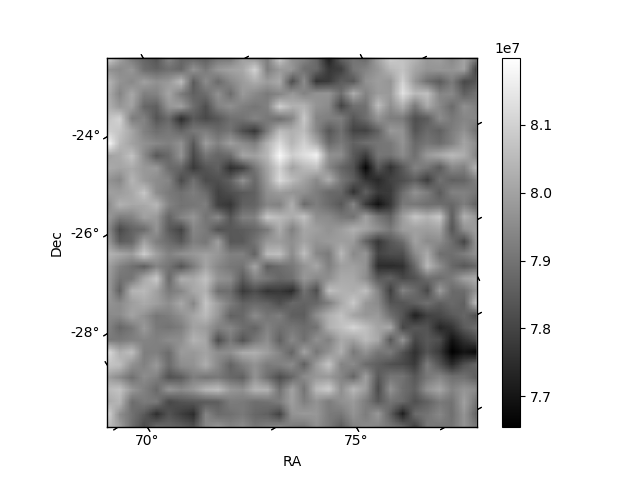
Quadrant B |
|---|---|---|---|
| Quadrant D | 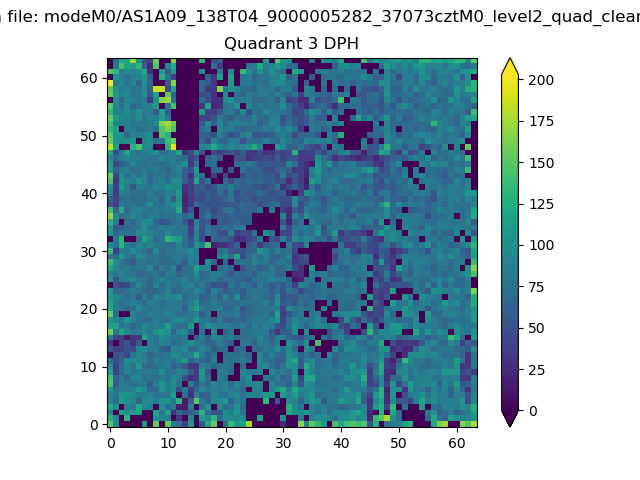 |
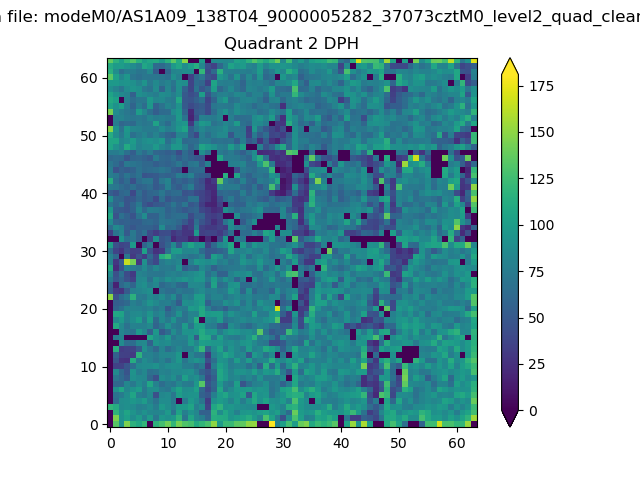 |
Quadrant C |
| Plot type | Count rate plots | Images |
|---|---|---|
| Comparison with Poisson distribution Blue bars denote a histogram of data divided into 1 sec bins. Red curve is a Poisson curve with rate = median count rate of data. |
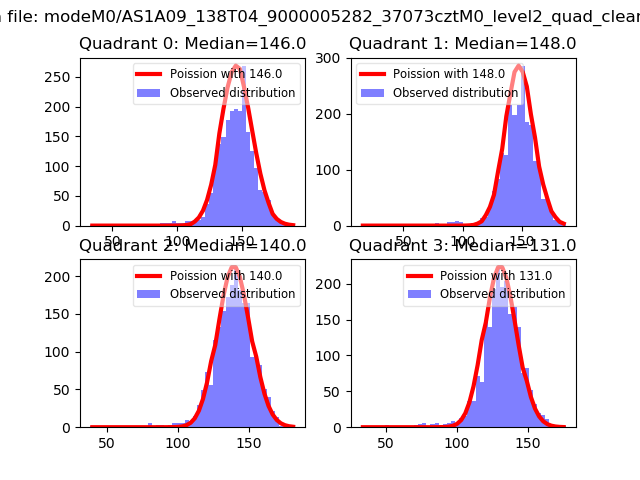 |
 |
| Quadrant-wise count rates Data is divided into 100 sec bins |
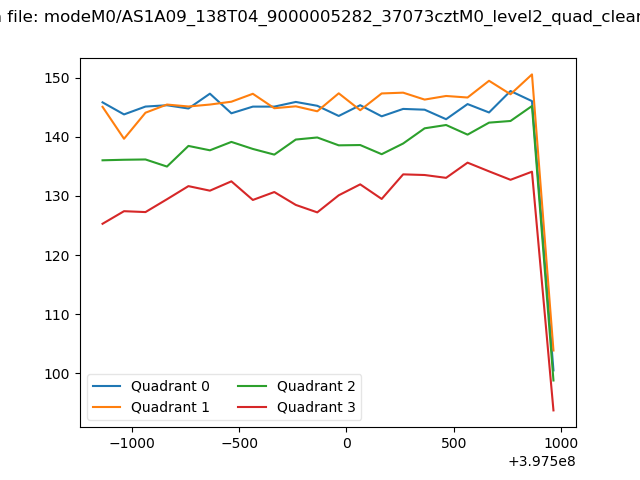 |
|
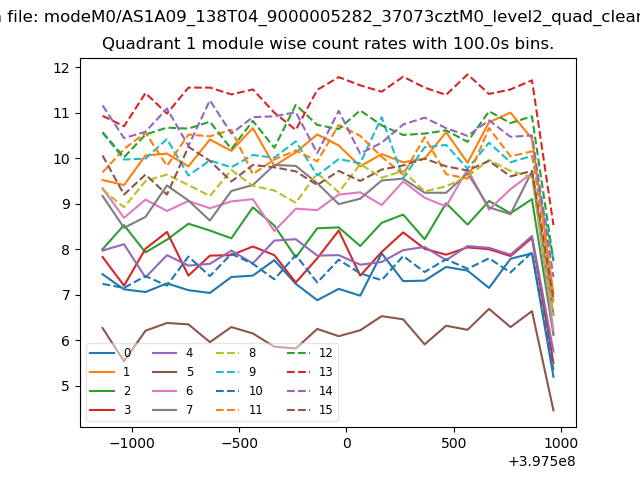
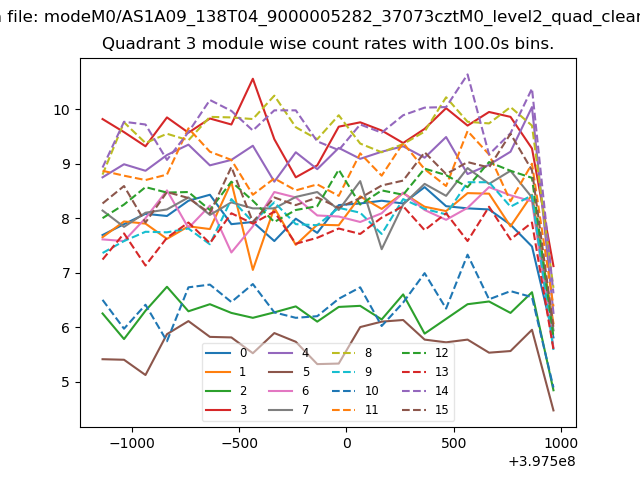
| Module-wise count rates for Quadrant A Data is divided into 100 sec bins |
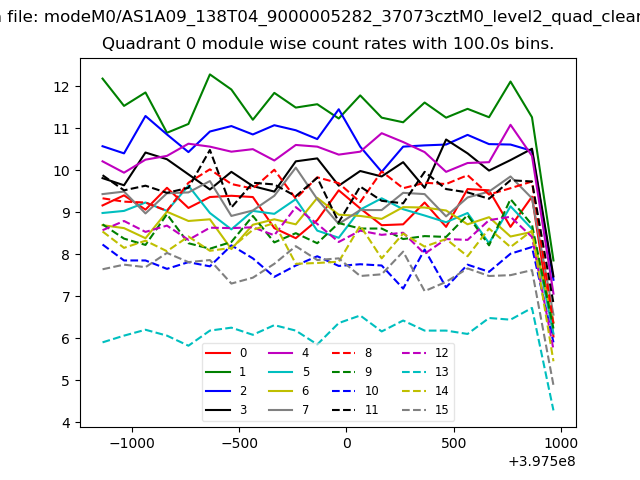 |
 |
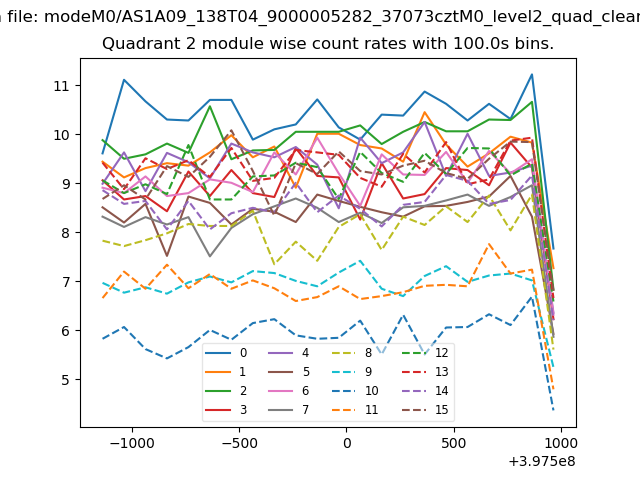
| Module-wise count rates for Quadrant B Data is divided into 100 sec bins |
 |
 |
| Module-wise count rates for Quadrant C Data is divided into 100 sec bins |
 |
 |
| Module-wise count rates for Quadrant D Data is divided into 100 sec bins |
 |
 |
| Parameter | Plot |
|---|---|
| CZT HV Monitor | 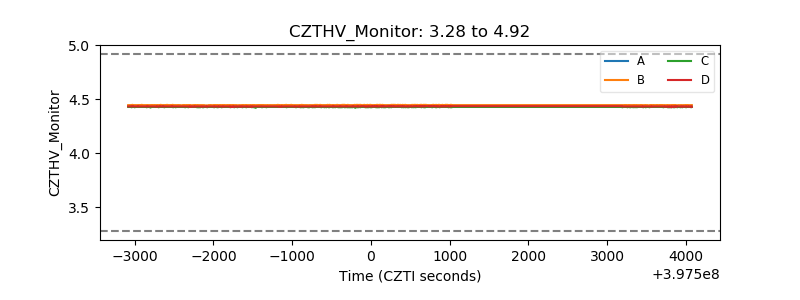 |
| D_VDD | 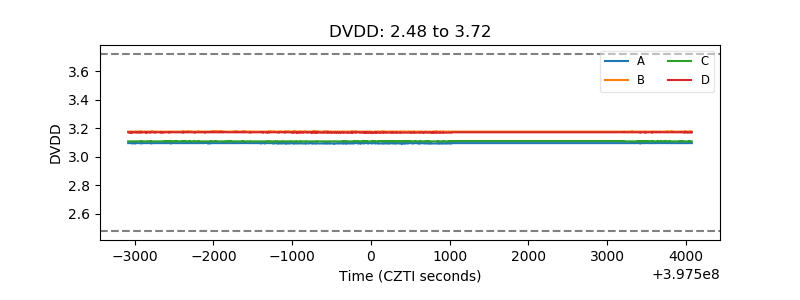 |
| Temperature 1 | 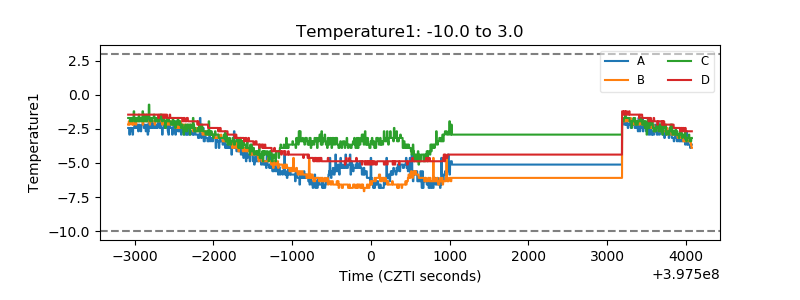 |
| Veto HV Monitor |  |
| Veto LLD | 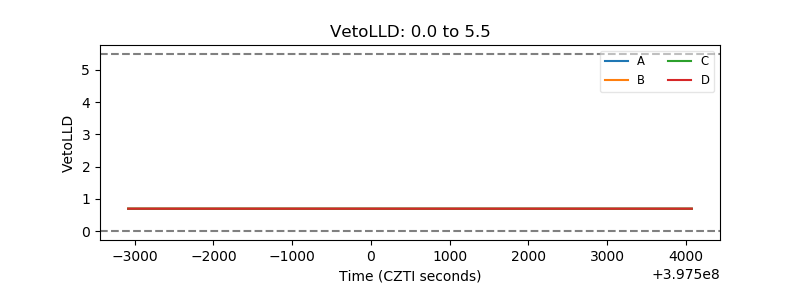 |
| Alpha Counter | 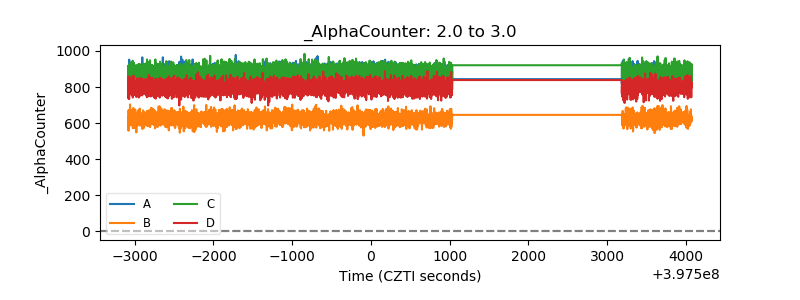 |
| _CPM_Rate | 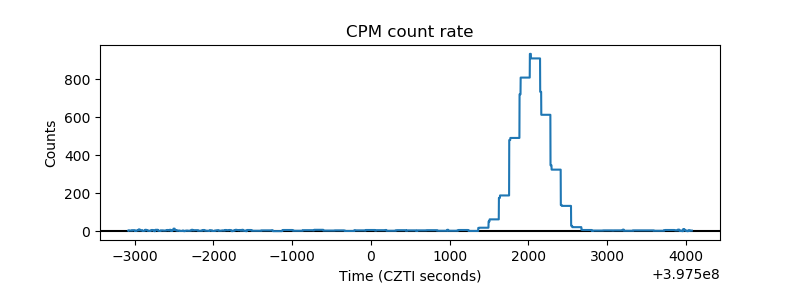 |
| CZT Counter | 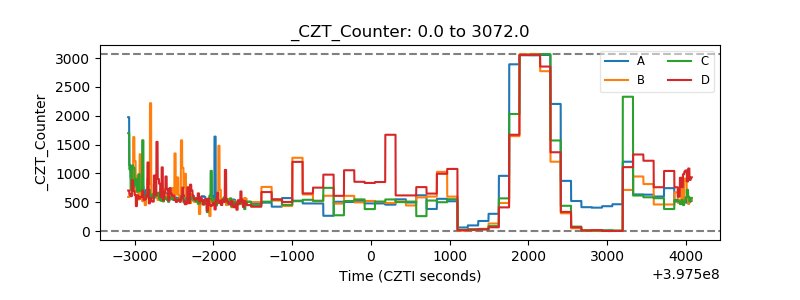 |
| +2.5 Volts monitor | 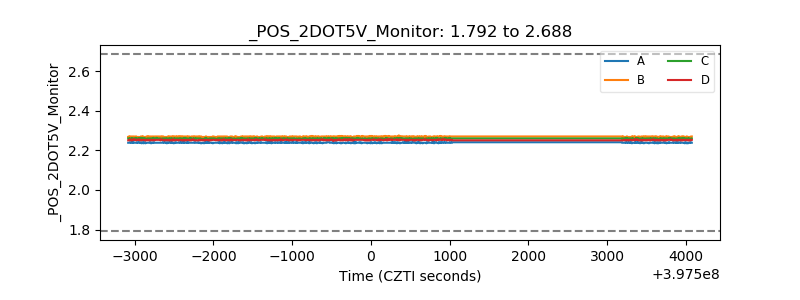 |
| +5 Volts monitor | 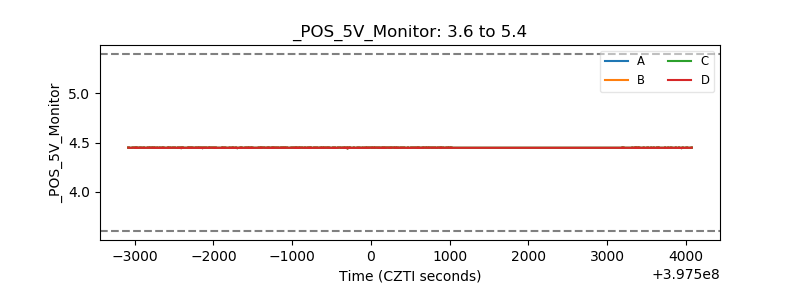 |
| _ROLL_ROT | 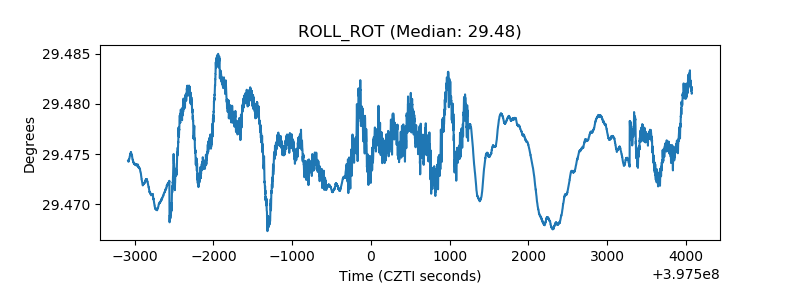 |
| _Roll_DEC | 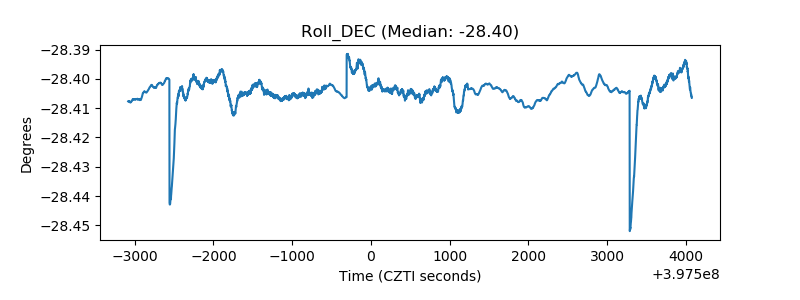 |
| _Roll_RA | 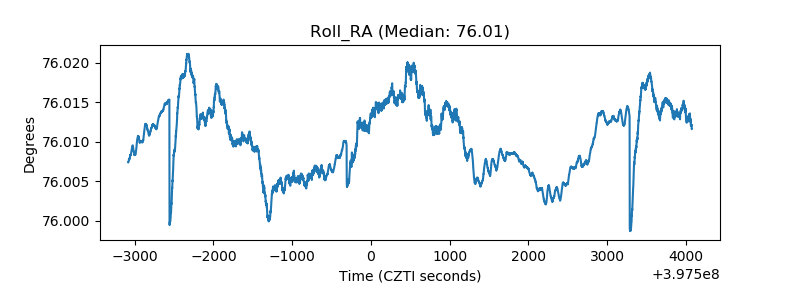 |
| Veto Counter | 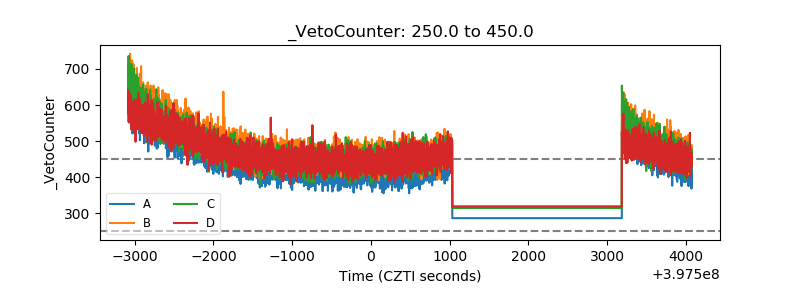 |