| Param | Original file | Final file |
|---|---|---|
| Filename | modeM0/AS1A11_079T01_9000005284_37134cztM0_level2.evt | modeM0/AS1A11_079T01_9000005284_37134cztM0_level2_quad_clean.evt |
| Size (bytes) | 442,915,200 | 67,550,400 |
| Size | 422.4 MB | 64.4 MB |
| Events in quadrant A | 2,783,842 | 428,732 |
| Events in quadrant B | 2,940,797 | 424,614 |
| Events in quadrant C | 3,189,929 | 421,129 |
| Events in quadrant D | 4,113,024 | 373,397 |
| Mode M9 | |||
|---|---|---|---|
| Quadrant | BADHDUFLAG | Total packets | Discarded packets |
| A | 0 | 25 | 0 |
| B | 0 | 25 | 0 |
| C | 0 | 25 | 0 |
| D | 0 | 26 | 0 |
| Mode SS | |||
|---|---|---|---|
| Quadrant | BADHDUFLAG | Total packets | Discarded packets |
| A | 0 | 118 | 0 |
| B | 0 | 118 | 0 |
| C | 0 | 118 | 0 |
| D | 0 | 118 | 0 |
| Mode M0 | |||
|---|---|---|---|
| Quadrant | BADHDUFLAG | Total packets | Discarded packets |
| A | 0 | 11981 | 3 |
| B | 0 | 12525 | 2 |
| C | 0 | 13008 | 2 |
| D | 0 | 16189 | 2 |
| Quadrant | Total seconds | Saturated seconds | Saturation percentage |
|---|---|---|---|
| A | 5672 | 11 | 0.193935% |
| B | 5672 | 63 | 1.110719% |
| C | 5672 | 106 | 1.868829% |
| D | 5672 | 516 | 9.097320% |
Noise dominated data is calculated using 1-second bins in cleaned event files. If a bin has >2000 counts, and if more than 50% of those come from <1% of pixels, then it is considered to be noise-dominated and hence unusable.
| Quadrant | # 1 sec bins | Bins with >0 counts | Bins with >2000 counts | High rate bins dominated by noise | Noise dominated (total time) | Noise dominated (detector-on time) | Marked lightcurve |
|---|---|---|---|---|---|---|---|
| A | 7105 | 5673 | 4 | 4 | 0.06% | 0.07% | 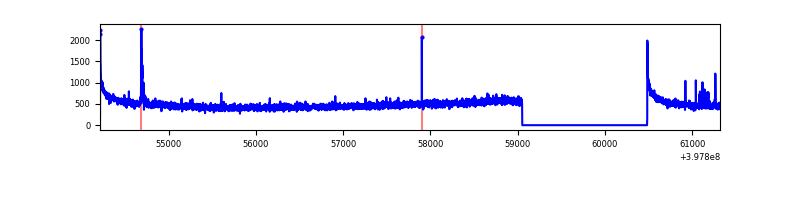 |
| B | 7105 | 5673 | 49 | 49 | 0.69% | 0.86% | 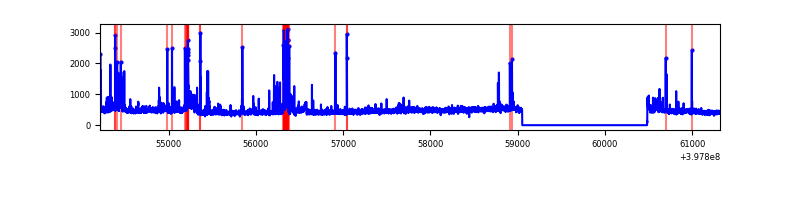 |
| C | 7105 | 5673 | 88 | 88 | 1.24% | 1.55% | 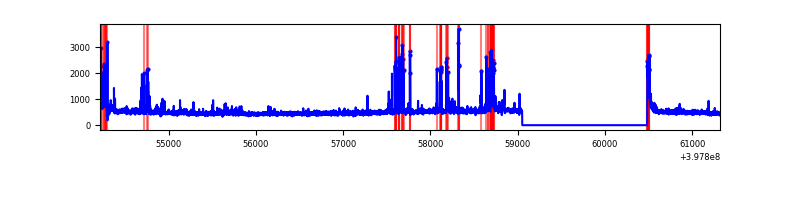 |
| D | 7105 | 5673 | 423 | 423 | 5.95% | 7.46% | 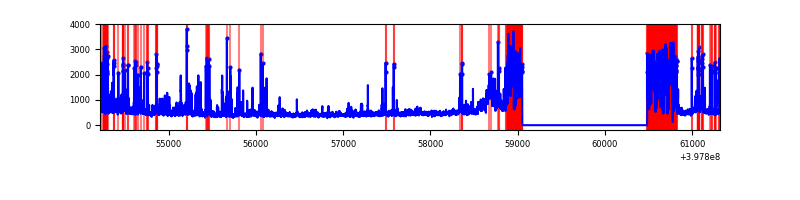 |
Top three noisy pixels from each quadrant. If the there are fewer than three noisy pixels in the level2.evt file, extra rows are filled as -1
| Pixel properties | Quadrant properties | ||||||
|---|---|---|---|---|---|---|---|
| Quadrant | DetID | PixID | Counts | Sigma | Mean | Median | Sigma |
| A | 10 | 83 | 263712 | 2021.65 | 639 | 627 | 130.1 |
| A | 9 | 143 | 27535 | 206.77 | 639 | 627 | 130.1 |
| A | 13 | 6 | 11958 | 87.07 | 639 | 627 | 130.1 |
| B | 5 | 172 | 188580 | 1538.52 | 631 | 614 | 122.2 |
| B | 5 | 184 | 113476 | 923.79 | 631 | 614 | 122.2 |
| B | 5 | 200 | 87341 | 709.87 | 631 | 614 | 122.2 |
| C | 14 | 254 | 285105 | 1958.37 | 619 | 624 | 145.3 |
| C | 15 | 214 | 261615 | 1796.67 | 619 | 624 | 145.3 |
| C | 0 | 10 | 178927 | 1227.44 | 619 | 624 | 145.3 |
| D | 2 | 249 | 1107250 | 7645.4 | 593 | 576 | 144.8 |
| D | 13 | 249 | 222567 | 1533.61 | 593 | 576 | 144.8 |
| D | 12 | 235 | 142634 | 981.4 | 593 | 576 | 144.8 |
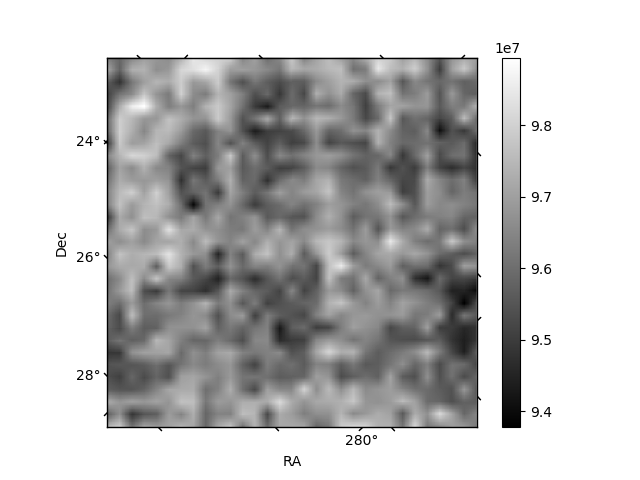
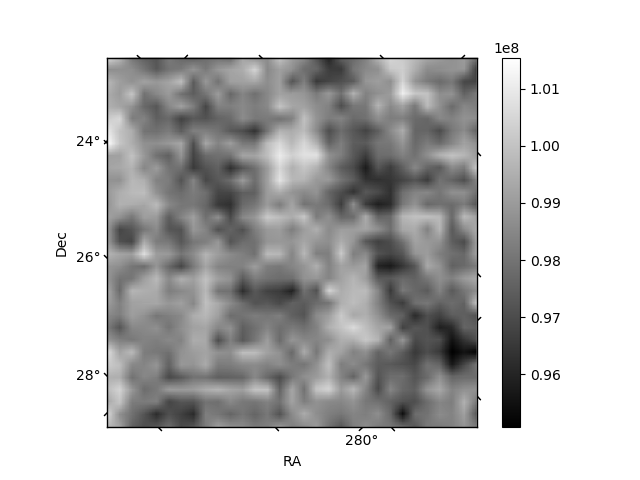
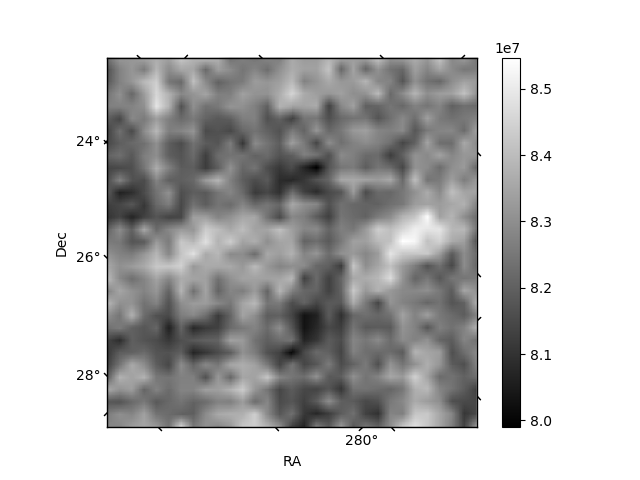
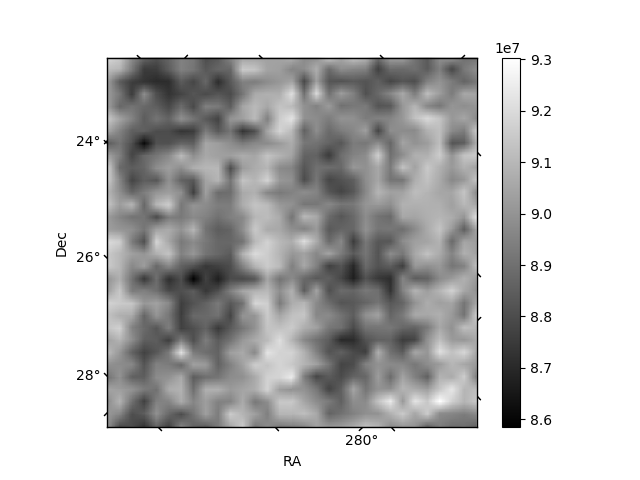
Histogram calculated using DETX and DETY for each event in the final _common_clean file
| Quadrant A | 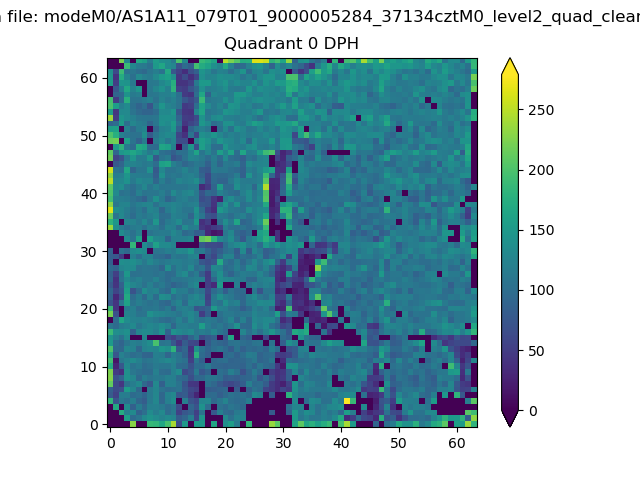 |
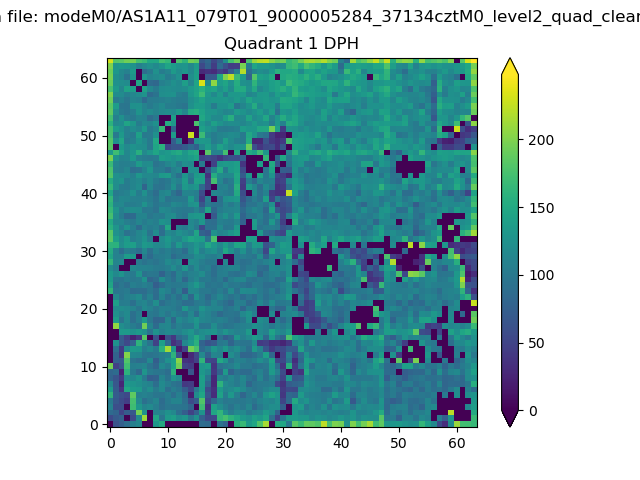 |
Quadrant B |
|---|---|---|---|
| Quadrant D | 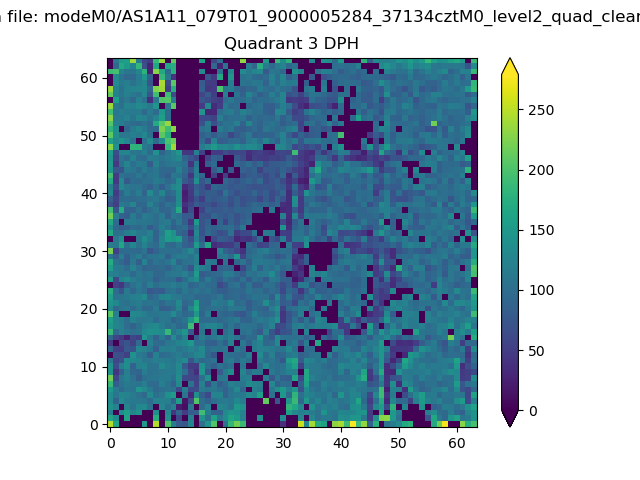 |
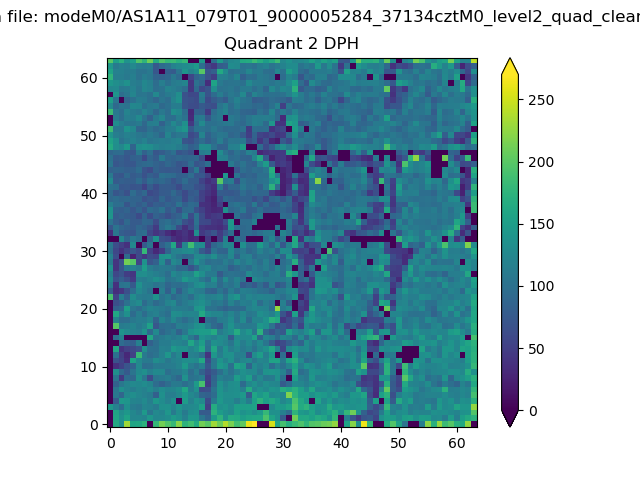 |
Quadrant C |
| Plot type | Count rate plots | Images |
|---|---|---|
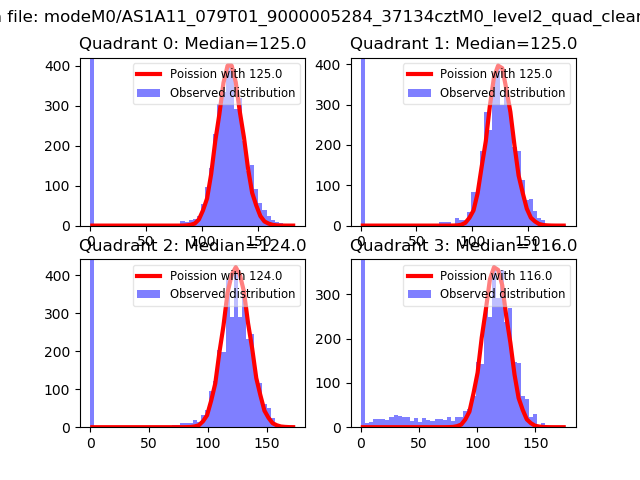
| Comparison with Poisson distribution Blue bars denote a histogram of data divided into 1 sec bins. Red curve is a Poisson curve with rate = median count rate of data. |
 |
 |
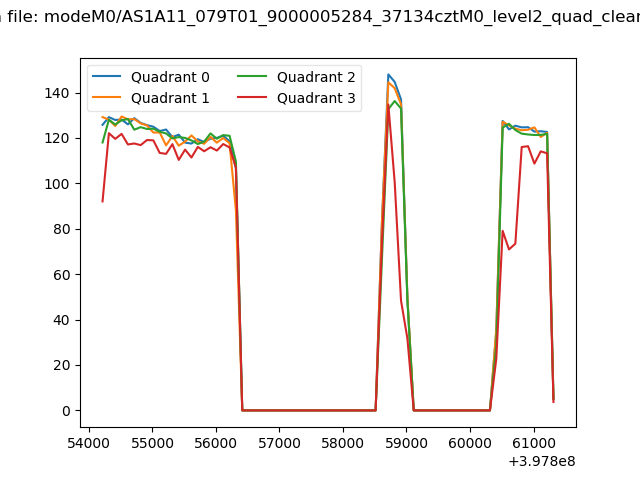
| Quadrant-wise count rates Data is divided into 100 sec bins |
 |
|
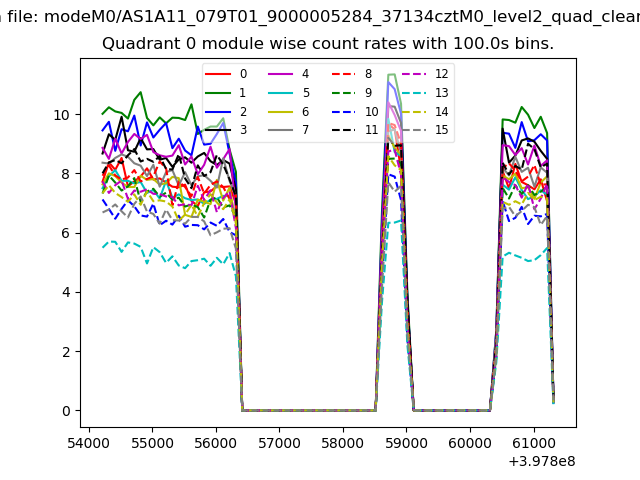
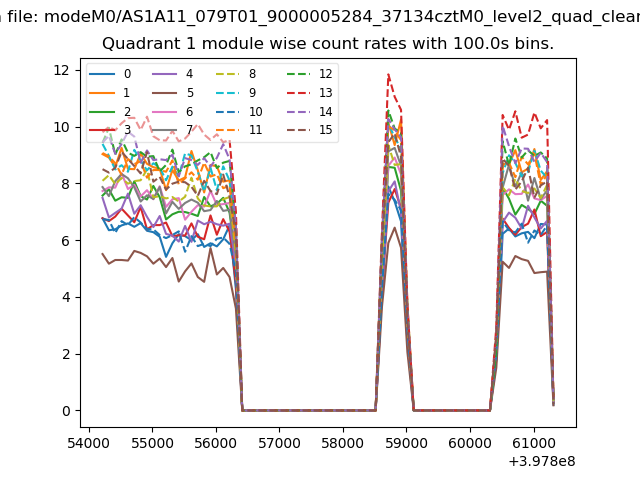
| Module-wise count rates for Quadrant A Data is divided into 100 sec bins |
 |
 |
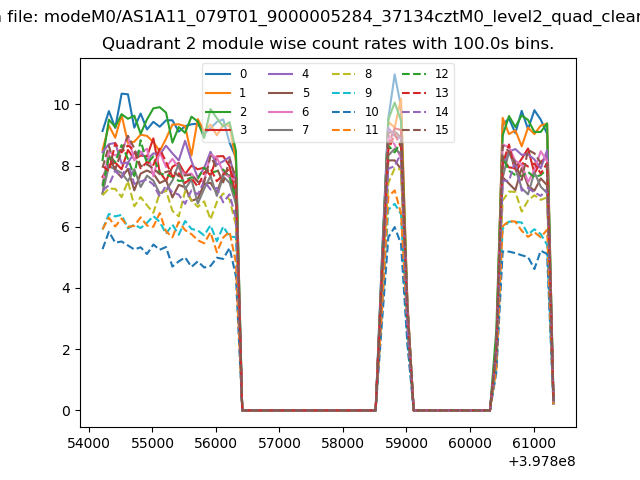
| Module-wise count rates for Quadrant B Data is divided into 100 sec bins |
 |
 |
| Module-wise count rates for Quadrant C Data is divided into 100 sec bins |
 |
 |
| Module-wise count rates for Quadrant D Data is divided into 100 sec bins |
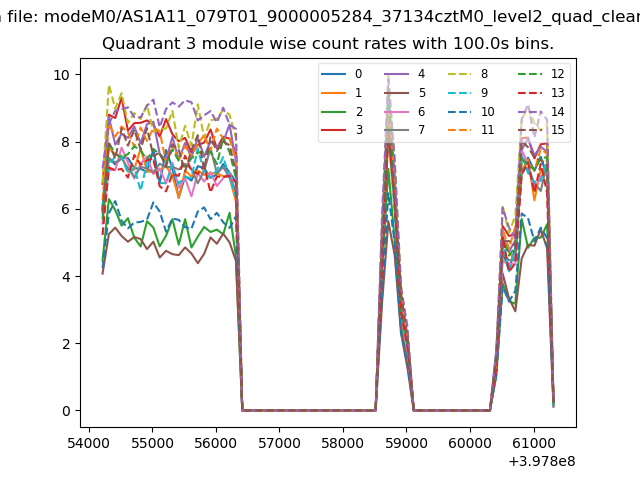 |
 |
| Parameter | Plot |
|---|---|
| CZT HV Monitor | 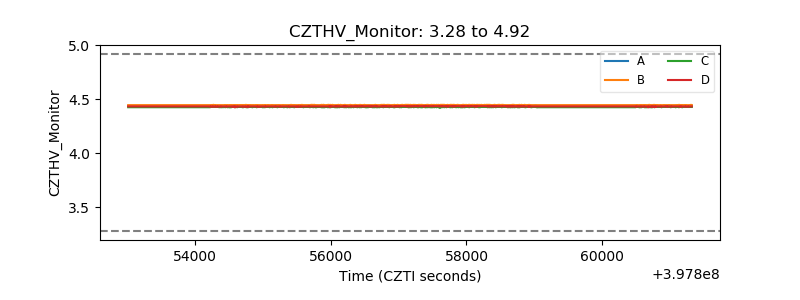 |
| D_VDD | 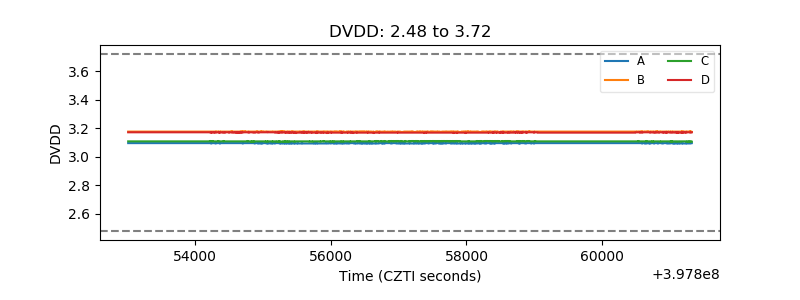 |
| Temperature 1 | 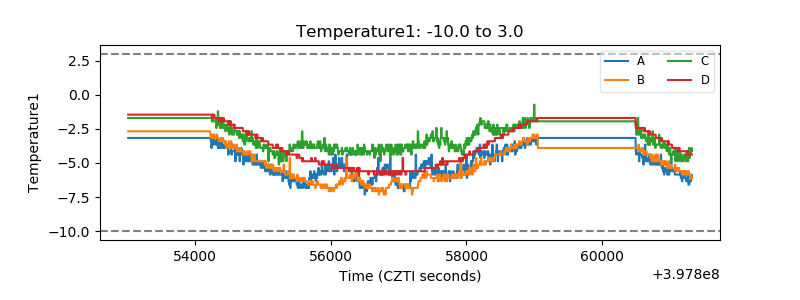 |
| Veto HV Monitor | 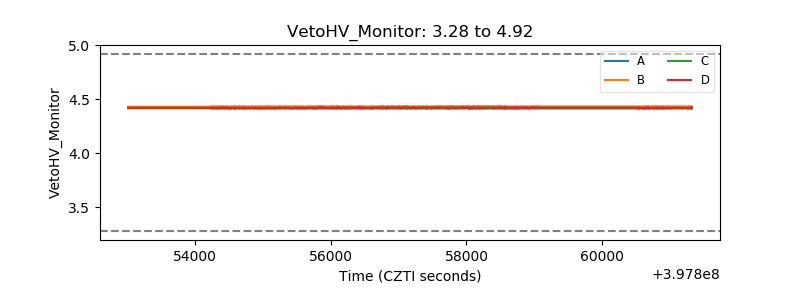 |
| Veto LLD | 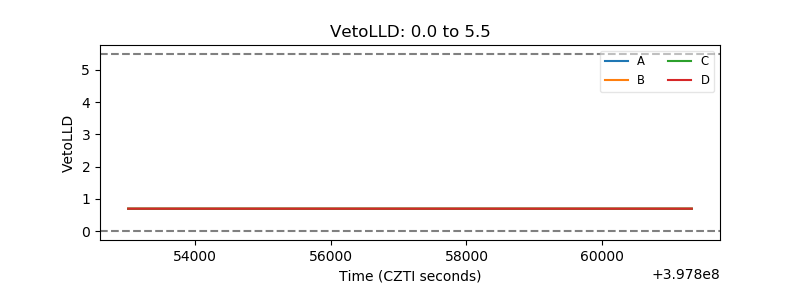 |
| Alpha Counter | 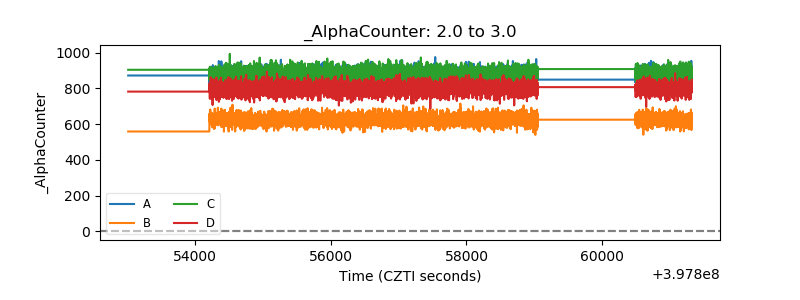 |
| _CPM_Rate | 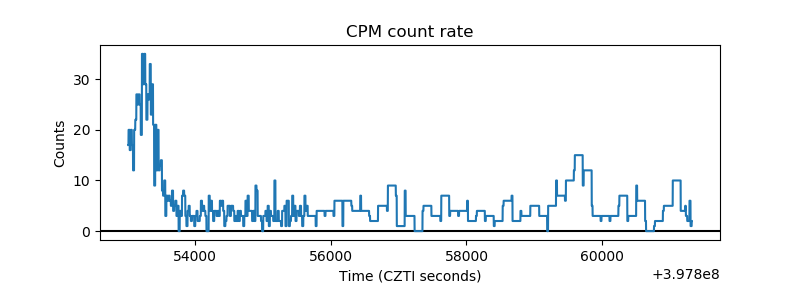 |
| CZT Counter | 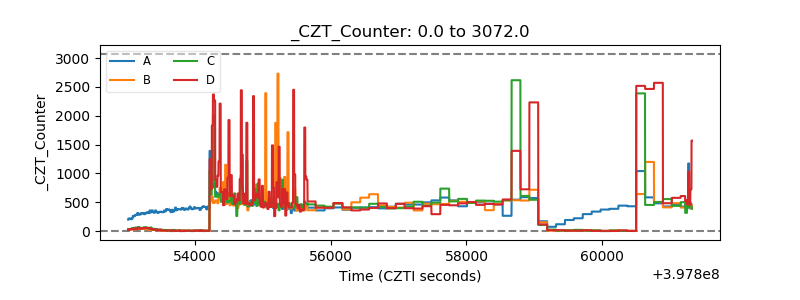 |
| +2.5 Volts monitor | 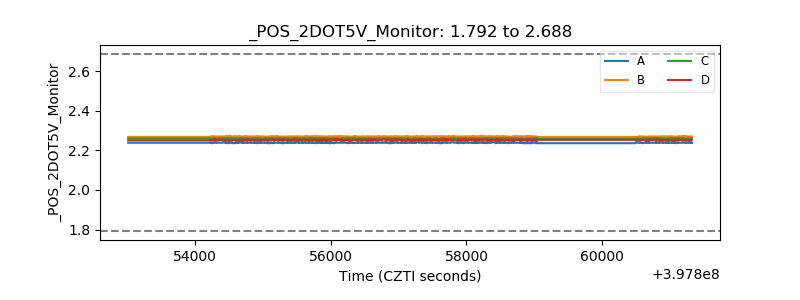 |
| +5 Volts monitor | 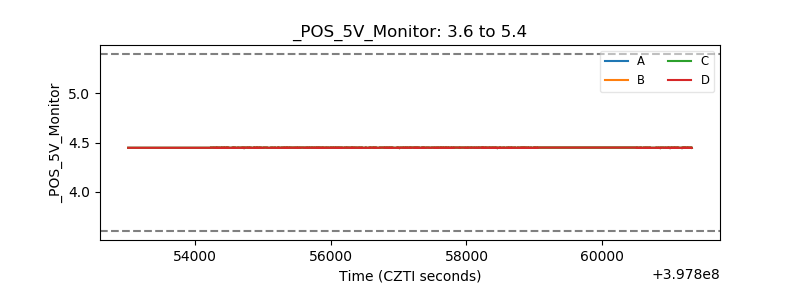 |
| _ROLL_ROT | 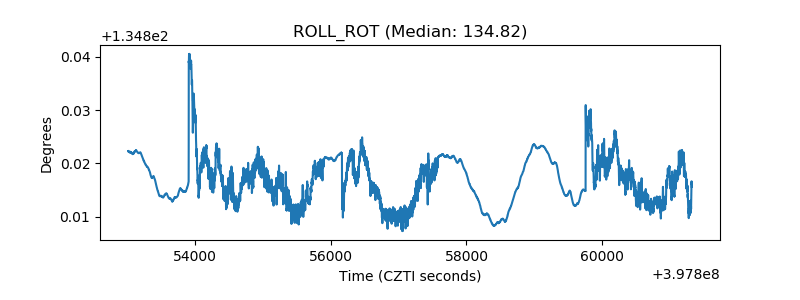 |
| _Roll_DEC | 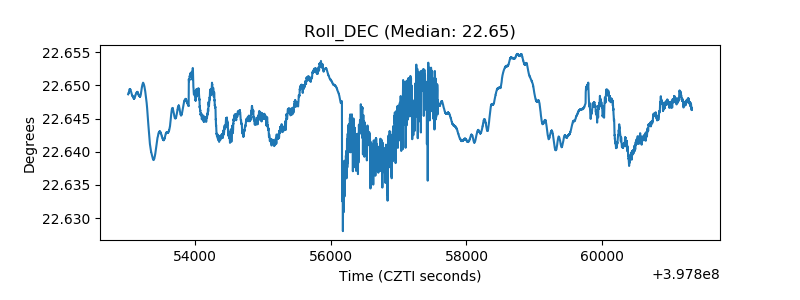 |
| _Roll_RA | 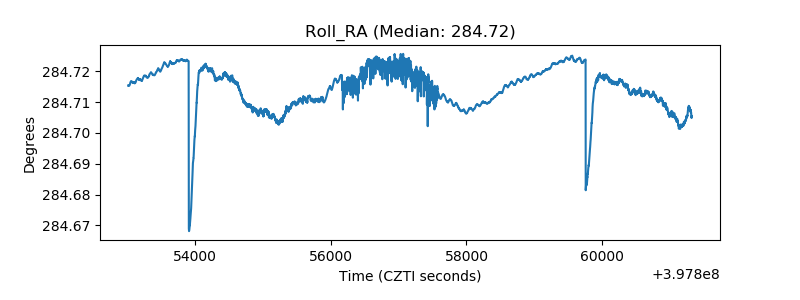 |
| Veto Counter | 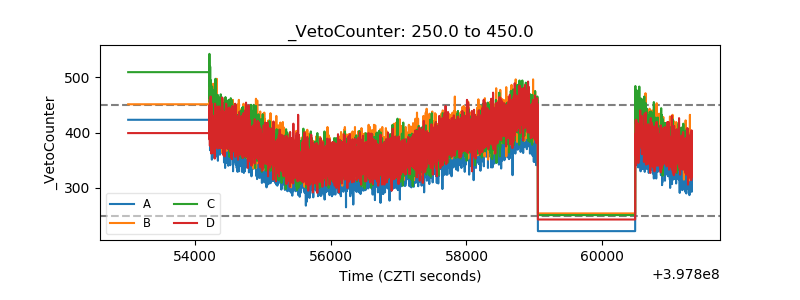 |