| Param | Original file | Final file |
|---|---|---|
| Filename | modeM0/AS1A07_145T01_9000005370_38205cztM0_level2.fits | modeM0/AS1A07_145T01_9000005370_38205cztM0_level2_quad_clean.evt |
| Size (bytes) | 25,513,920 | 6,192,000 |
| Size | 24.3 MB | 5.9 MB |
| Events in quadrant A | 181,910 | 39,663 |
| Events in quadrant B | 166,577 | 42,480 |
| Events in quadrant C | 175,080 | 40,389 |
| Events in quadrant D | 388,327 | 31,225 |
| Mode M9 | |||
|---|---|---|---|
| Quadrant | BADHDUFLAG | Total packets | Discarded packets |
| A | 0 | 1 | 1 |
| B | 1 | 1 | 1 |
| C | 1 | -1 | -1 |
| D | 1 | -1 | -1 |
| Mode SS | |||
|---|---|---|---|
| Quadrant | BADHDUFLAG | Total packets | Discarded packets |
| A | 0 | 9 | 1 |
| B | 0 | 11 | 3 |
| C | 0 | 9 | 1 |
| D | 0 | 12 | 4 |
| Mode M0 | |||
|---|---|---|---|
| Quadrant | BADHDUFLAG | Total packets | Discarded packets |
| A | 0 | 864 | 123 |
| B | 0 | 857 | 109 |
| C | 0 | 879 | 135 |
| D | 0 | 1550 | 140 |
| Quadrant | Total seconds | Saturated seconds | Saturation percentage |
|---|---|---|---|
| A | 368 | 2 | 0.543478% |
| B | 373 | 0 | 0.000000% |
| C | 370 | 0 | 0.000000% |
| D | 370 | 75 | 20.270270% |
Noise dominated data is calculated using 1-second bins in cleaned event files. If a bin has >2000 counts, and if more than 50% of those come from <1% of pixels, then it is considered to be noise-dominated and hence unusable.
| Quadrant | # 1 sec bins | Bins with >0 counts | Bins with >2000 counts | High rate bins dominated by noise | Noise dominated (total time) | Noise dominated (detector-on time) | Marked lightcurve |
|---|---|---|---|---|---|---|---|
| A | 375 | 372 | 0 | 0 | 0.00% | 0.00% | 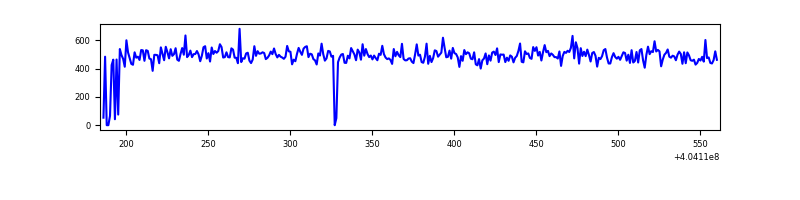 |
| B | 377 | 375 | 0 | 0 | 0.00% | 0.00% | 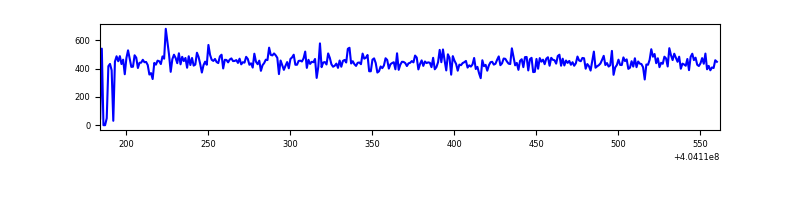 |
| C | 372 | 372 | 0 | 0 | 0.00% | 0.00% | 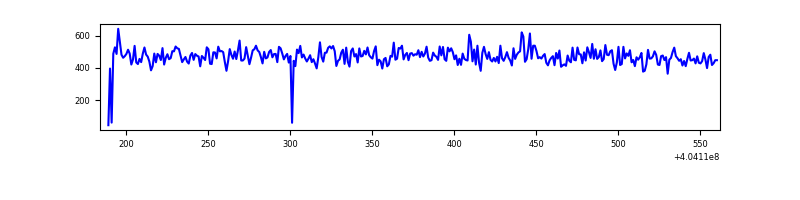 |
| D | 378 | 373 | 58 | 58 | 15.34% | 15.55% | 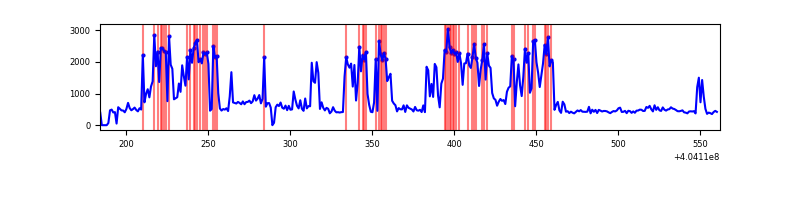 |
Top three noisy pixels from each quadrant. If the there are fewer than three noisy pixels in the level2.evt file, extra rows are filled as -1
| Pixel properties | Quadrant properties | ||||||
|---|---|---|---|---|---|---|---|
| Quadrant | DetID | PixID | Counts | Sigma | Mean | Median | Sigma |
| A | 10 | 83 | 21102 | 2002.03 | 41 | 40 | 10.5 |
| A | 12 | 189 | 1109 | 101.61 | 41 | 40 | 10.5 |
| A | 3 | 137 | 475 | 41.35 | 41 | 40 | 10.5 |
| B | 12 | 111 | 1111 | 103.47 | 42 | 41 | 10.3 |
| B | 11 | 111 | 1036 | 96.22 | 42 | 41 | 10.3 |
| B | 14 | 111 | 968 | 89.64 | 42 | 41 | 10.3 |
| C | 15 | 214 | 15147 | 1335.82 | 40 | 40 | 11.3 |
| C | 2 | 16 | 2238 | 194.36 | 40 | 40 | 11.3 |
| C | 14 | 254 | 598 | 49.34 | 40 | 40 | 11.3 |
| D | 13 | 171 | 238506 | 21994.4 | 36 | 35 | 10.8 |
| D | 2 | 16 | 3105 | 283.15 | 36 | 35 | 10.8 |
| D | 1 | 52 | 2522 | 229.38 | 36 | 35 | 10.8 |
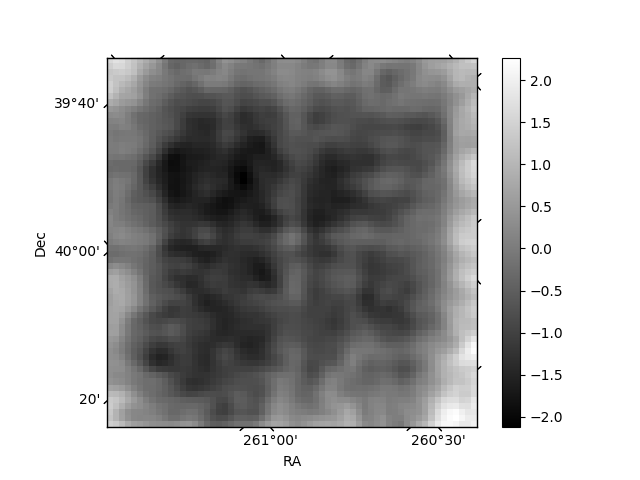
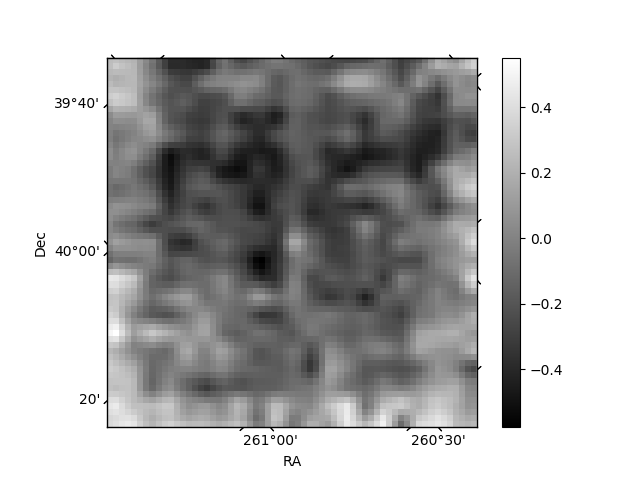
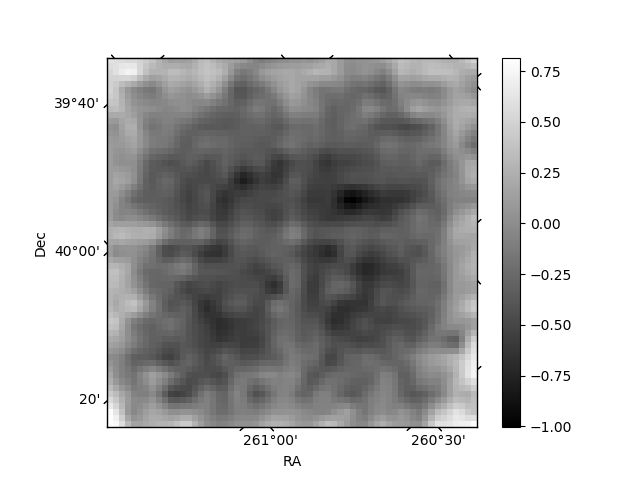
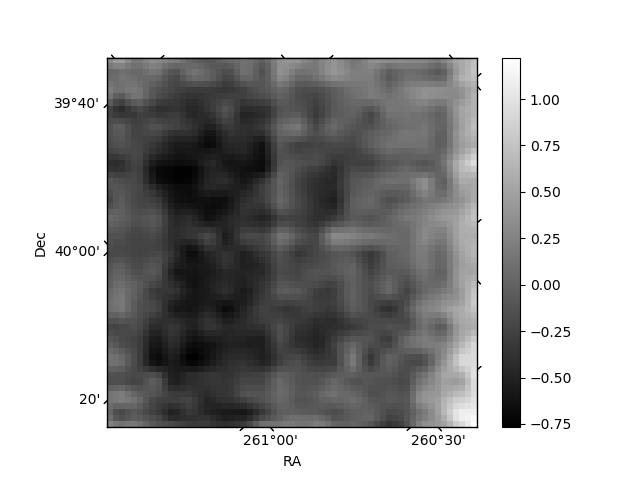
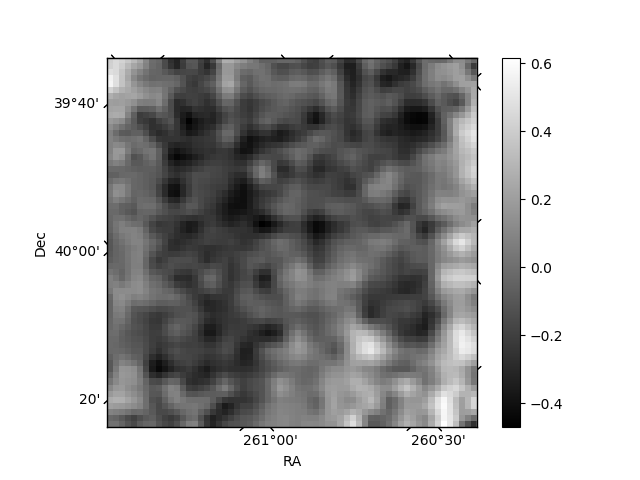
Histogram calculated using DETX and DETY for each event in the final _common_clean file
| Quadrant A | 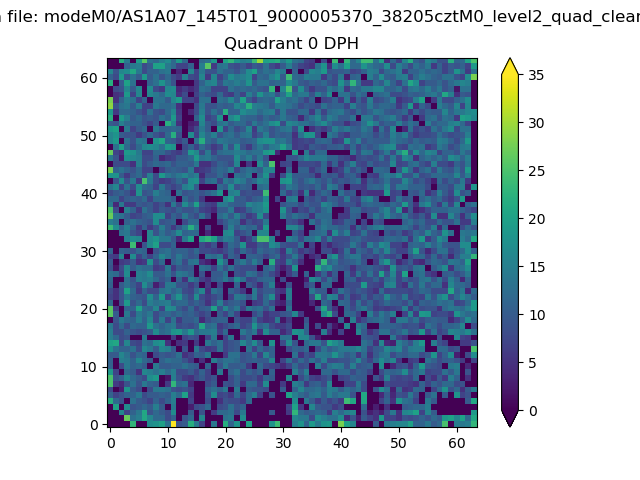 |
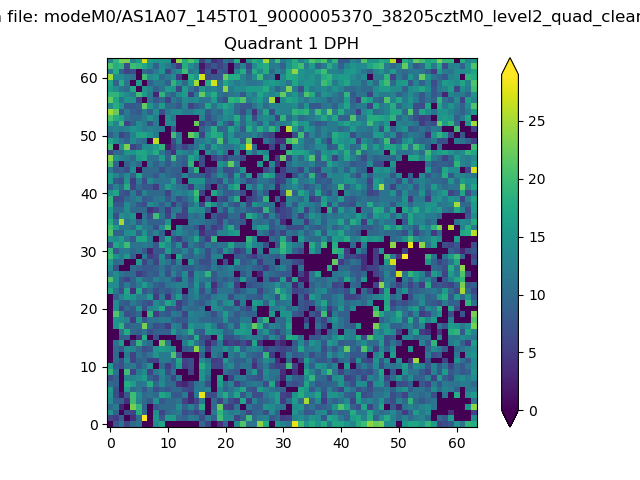 |
Quadrant B |
|---|---|---|---|
| Quadrant D | 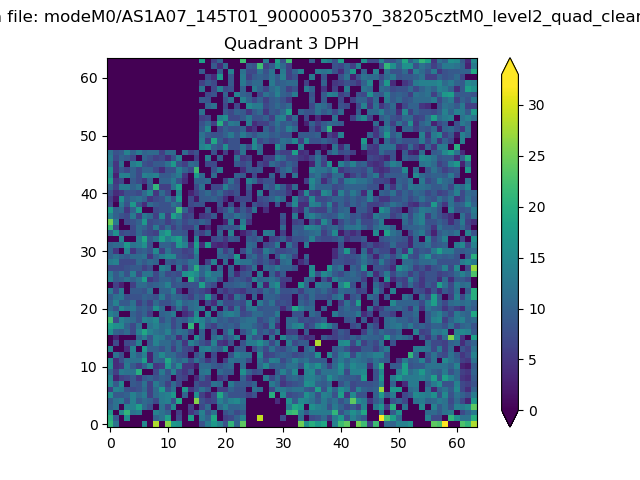 |
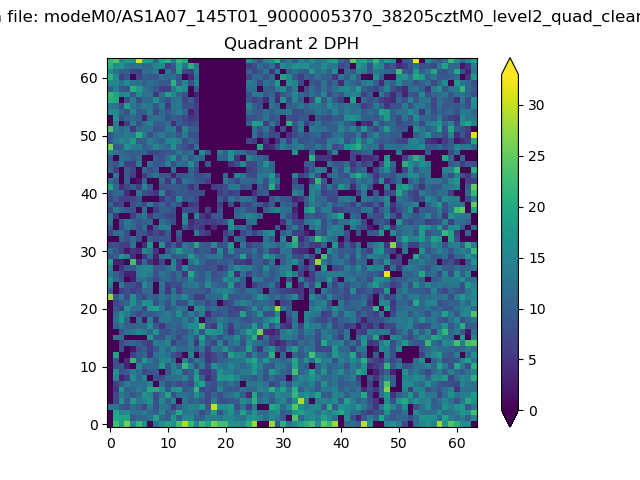 |
Quadrant C |
| Plot type | Count rate plots | Images |
|---|---|---|
| Comparison with Poisson distribution Blue bars denote a histogram of data divided into 1 sec bins. Red curve is a Poisson curve with rate = median count rate of data. |
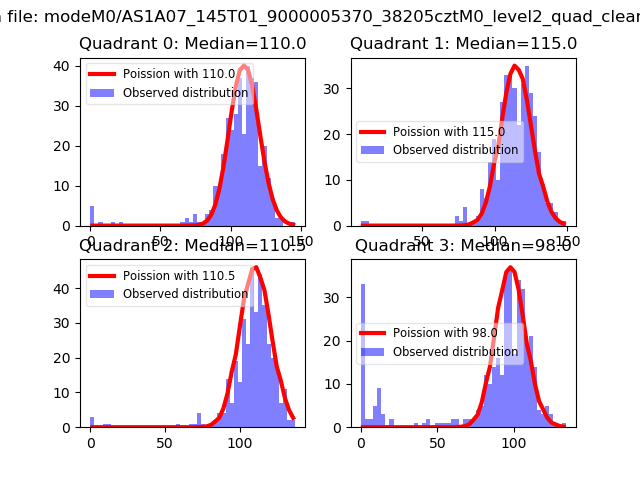 |
 |
| Quadrant-wise count rates Data is divided into 100 sec bins |
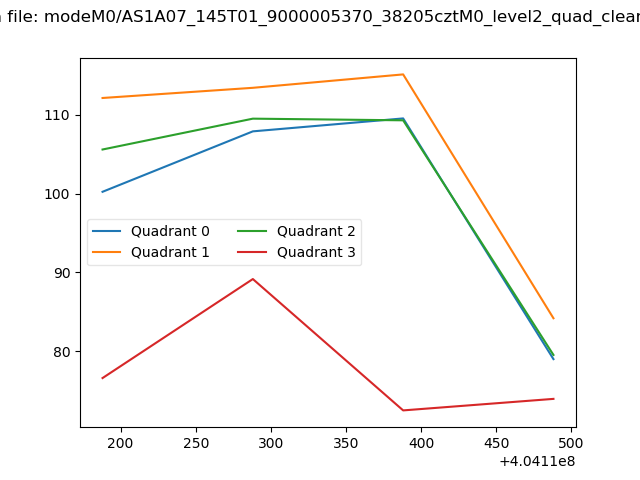 |
|
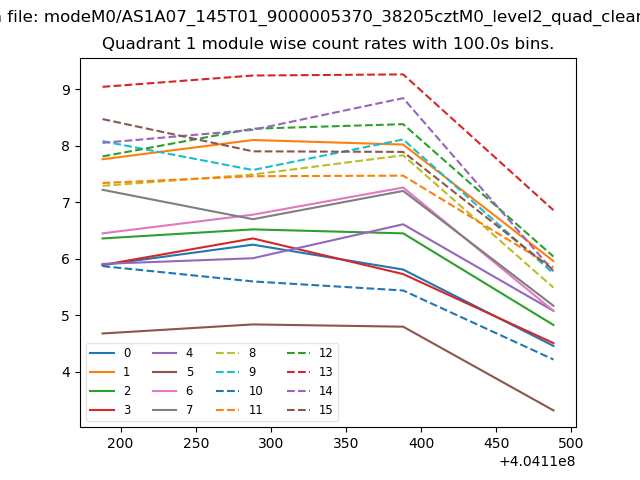
| Module-wise count rates for Quadrant A Data is divided into 100 sec bins |
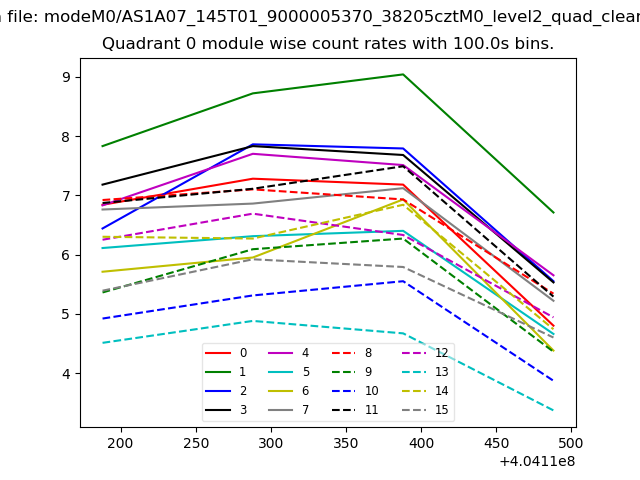 |
 |
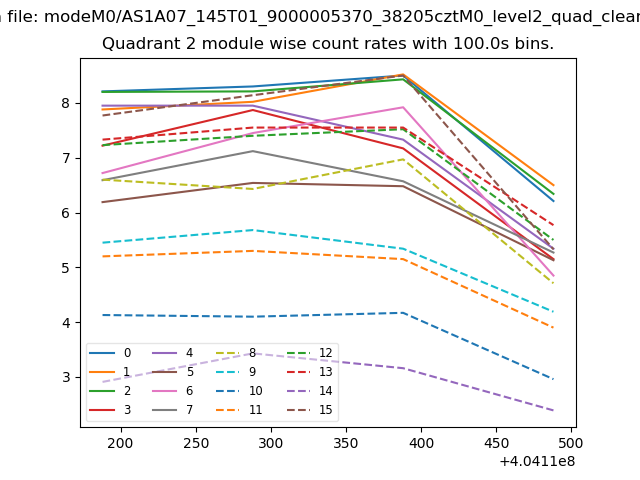
| Module-wise count rates for Quadrant B Data is divided into 100 sec bins |
 |
 |
| Module-wise count rates for Quadrant C Data is divided into 100 sec bins |
 |
 |
| Module-wise count rates for Quadrant D Data is divided into 100 sec bins |
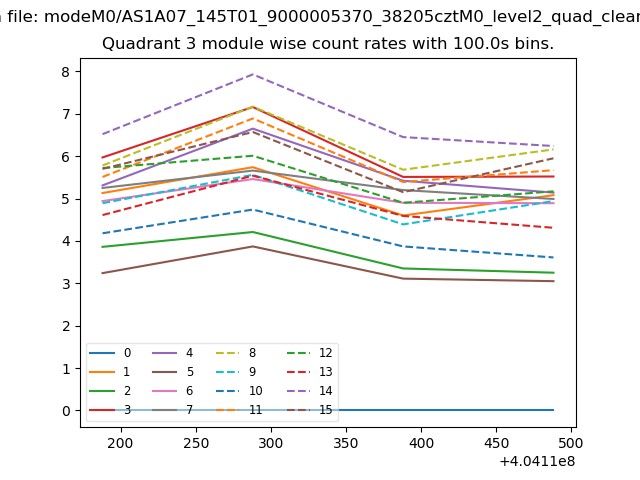 |
 |
| Parameter | Plot |
|---|---|
| CZT HV Monitor | 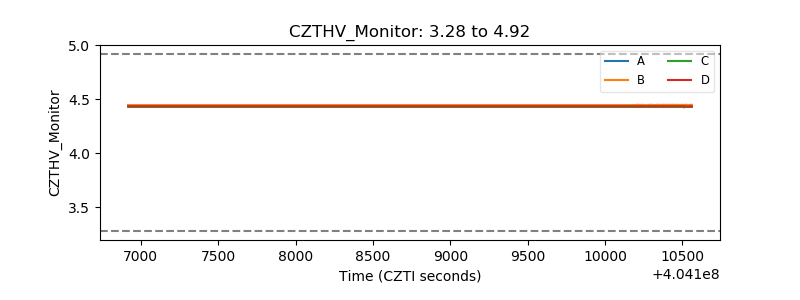 |
| D_VDD |  |
| Temperature 1 | 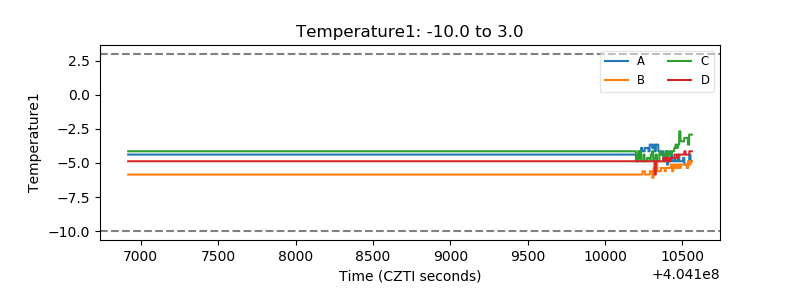 |
| Veto HV Monitor | 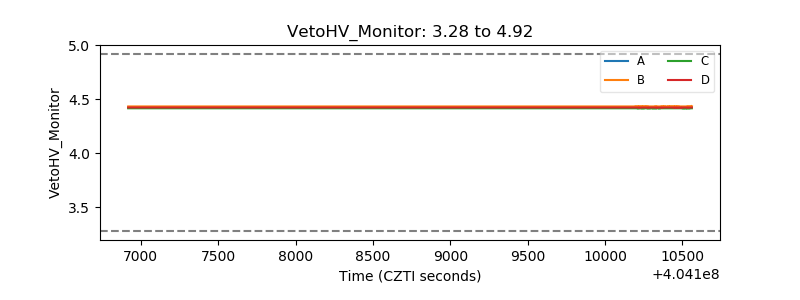 |
| Veto LLD | 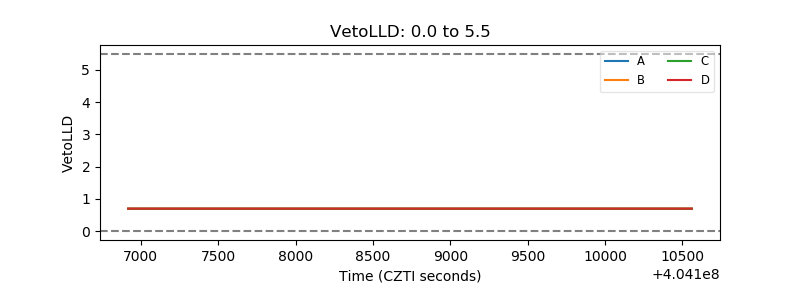 |
| Alpha Counter | 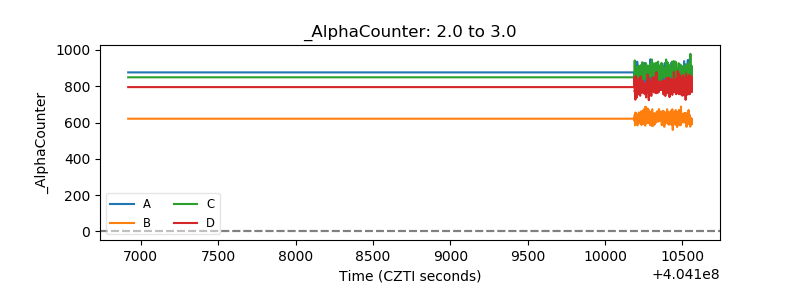 |
| _CPM_Rate | 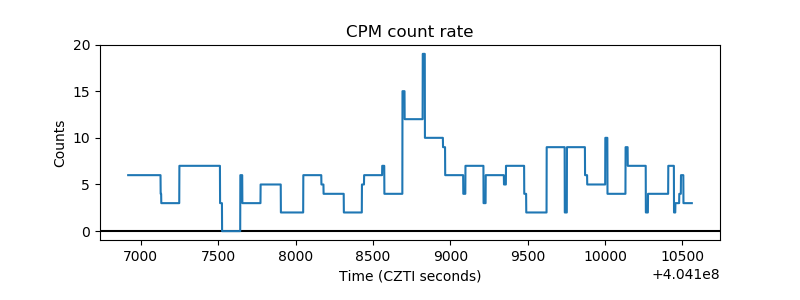 |
| CZT Counter | 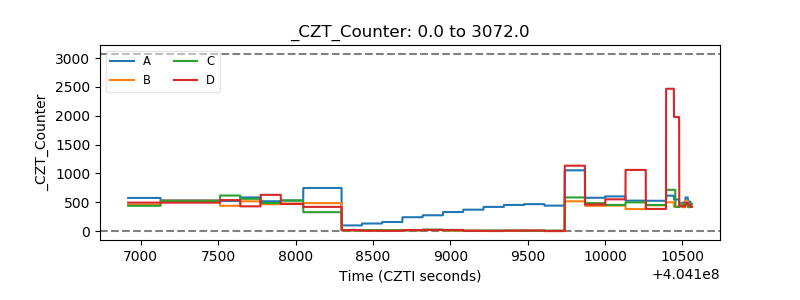 |
| +2.5 Volts monitor | 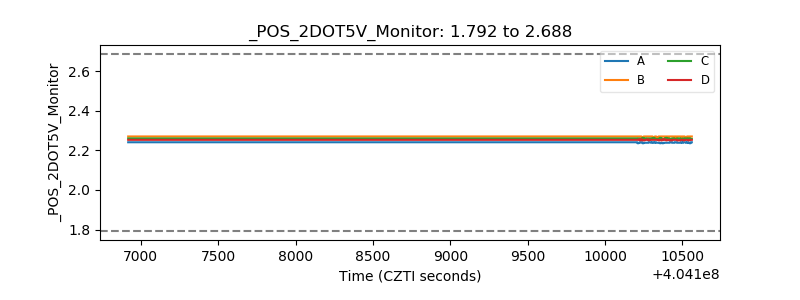 |
| +5 Volts monitor | 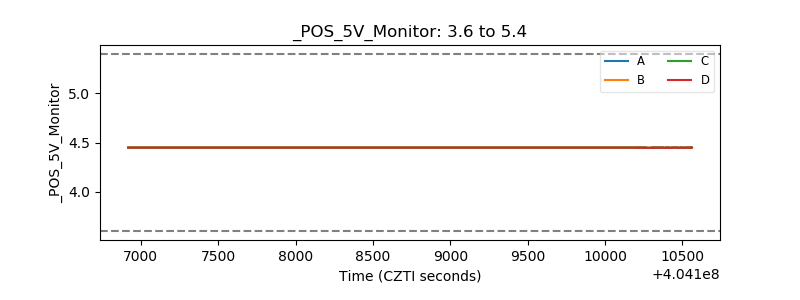 |
| _ROLL_ROT | 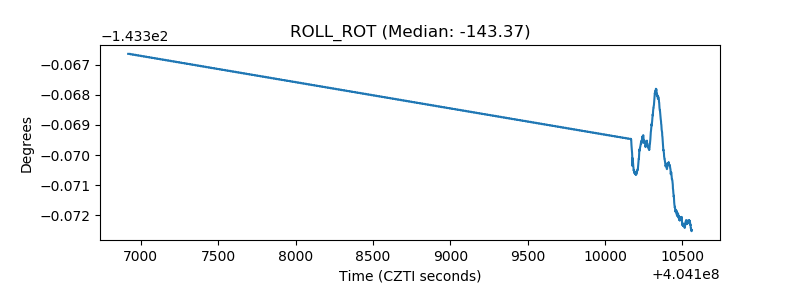 |
| _Roll_DEC | 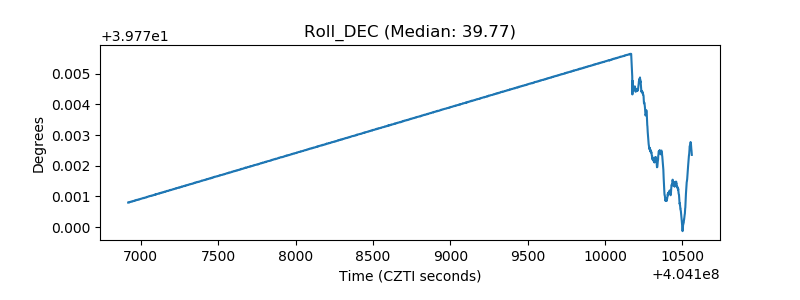 |
| _Roll_RA | 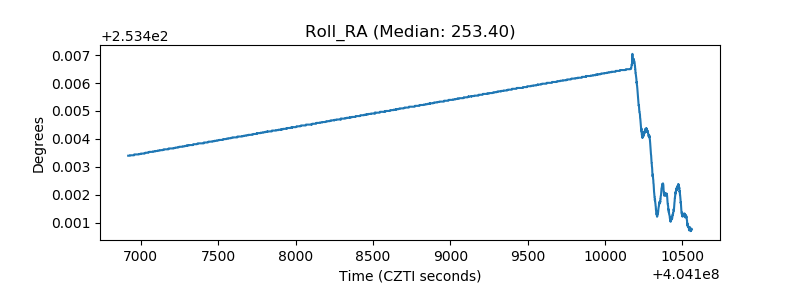 |
| Veto Counter | 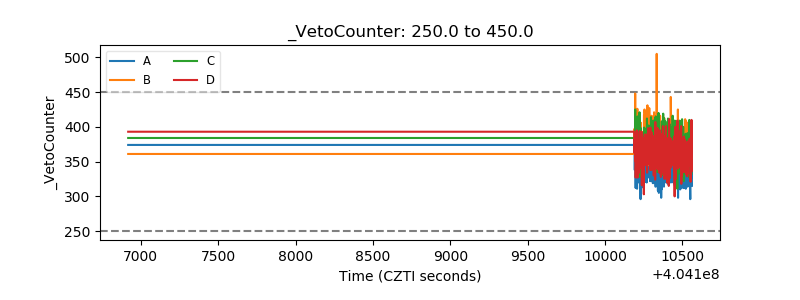 |