| Param | Original file | Final file |
|---|---|---|
| Filename | modeM0/AS1T05_064T01_9000005416_38896cztM0_level2.fits | modeM0/AS1T05_064T01_9000005416_38896cztM0_level2_quad_clean.evt |
| Size (bytes) | 454,556,160 | 86,189,760 |
| Size | 433.5 MB | 82.2 MB |
| Events in quadrant A | 2,682,985 | 629,910 |
| Events in quadrant B | 2,446,306 | 648,471 |
| Events in quadrant C | 2,627,283 | 628,581 |
| Events in quadrant D | 8,683,331 | 355,277 |
| Mode SS | |||
|---|---|---|---|
| Quadrant | BADHDUFLAG | Total packets | Discarded packets |
| A | 0 | 100 | 0 |
| B | 0 | 100 | 0 |
| C | 0 | 100 | 0 |
| D | 0 | 100 | 0 |
| Mode M9 | |||
|---|---|---|---|
| Quadrant | BADHDUFLAG | Total packets | Discarded packets |
| A | 0 | 26 | 0 |
| B | 0 | 26 | 0 |
| C | 0 | 26 | 0 |
| D | 0 | 27 | 0 |
| Mode M0 | |||
|---|---|---|---|
| Quadrant | BADHDUFLAG | Total packets | Discarded packets |
| A | 0 | 11028 | 2 |
| B | 0 | 10431 | 1 |
| C | 0 | 10718 | 1 |
| D | 0 | 29158 | 1 |
| Quadrant | Total seconds | Saturated seconds | Saturation percentage |
|---|---|---|---|
| A | 4963 | 16 | 0.322386% |
| B | 4963 | 35 | 0.705219% |
| C | 4963 | 28 | 0.564175% |
| D | 4963 | 2148 | 43.280274% |
Noise dominated data is calculated using 1-second bins in cleaned event files. If a bin has >2000 counts, and if more than 50% of those come from <1% of pixels, then it is considered to be noise-dominated and hence unusable.
| Quadrant | # 1 sec bins | Bins with >0 counts | Bins with >2000 counts | High rate bins dominated by noise | Noise dominated (total time) | Noise dominated (detector-on time) | Marked lightcurve |
|---|---|---|---|---|---|---|---|
| A | 7057 | 4964 | 8 | 8 | 0.11% | 0.16% | 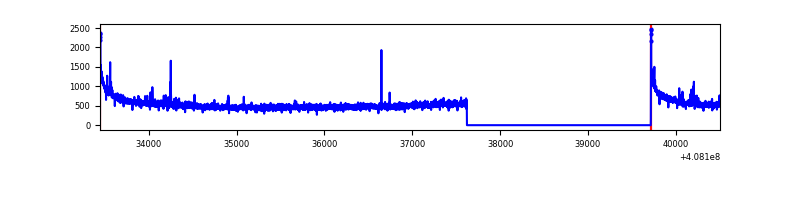 |
| B | 7057 | 4964 | 22 | 22 | 0.31% | 0.44% | 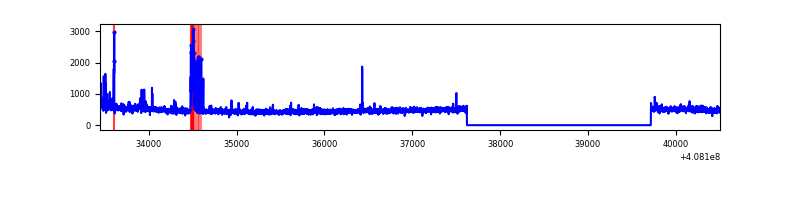 |
| C | 7057 | 4964 | 12 | 12 | 0.17% | 0.24% | 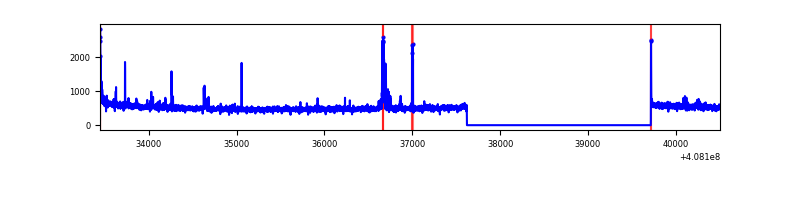 |
| D | 7056 | 4962 | 2179 | 2179 | 30.88% | 43.91% | 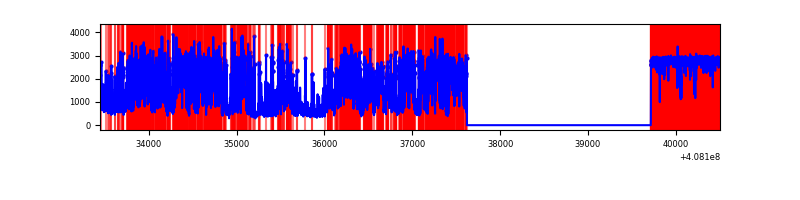 |
Top three noisy pixels from each quadrant. If the there are fewer than three noisy pixels in the level2.evt file, extra rows are filled as -1
| Pixel properties | Quadrant properties | ||||||
|---|---|---|---|---|---|---|---|
| Quadrant | DetID | PixID | Counts | Sigma | Mean | Median | Sigma |
| A | 10 | 83 | 411028 | 3576.46 | 574 | 564 | 114.8 |
| A | 9 | 143 | 15459 | 129.78 | 574 | 564 | 114.8 |
| A | 13 | 6 | 13588 | 113.48 | 574 | 564 | 114.8 |
| B | 0 | 229 | 110959 | 1012.13 | 579 | 563 | 109.1 |
| B | 5 | 172 | 16493 | 146.05 | 579 | 563 | 109.1 |
| B | 0 | 155 | 14378 | 126.66 | 579 | 563 | 109.1 |
| C | 15 | 214 | 206636 | 1565.32 | 575 | 579 | 131.6 |
| C | 14 | 254 | 119608 | 904.21 | 575 | 579 | 131.6 |
| C | 0 | 10 | 31444 | 234.47 | 575 | 579 | 131.6 |
| D | 12 | 227 | 6085945 | 57652.01 | 440 | 429 | 105.6 |
| D | 14 | 52 | 154523 | 1459.83 | 440 | 429 | 105.6 |
| D | 5 | 222 | 149513 | 1412.37 | 440 | 429 | 105.6 |
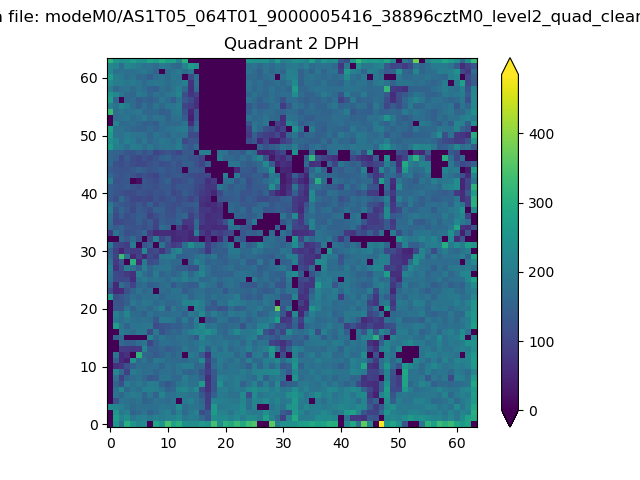
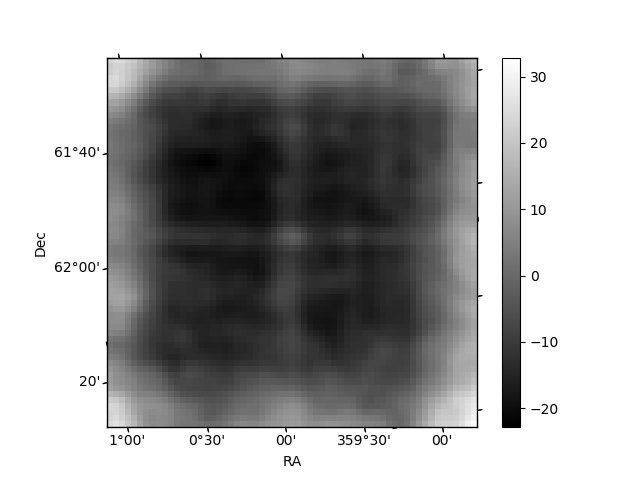
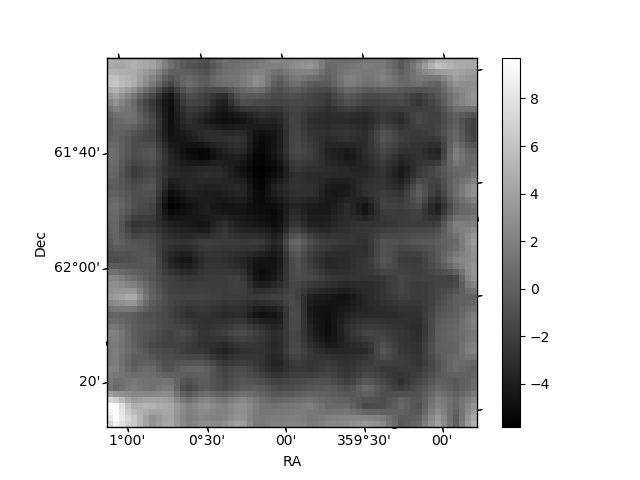
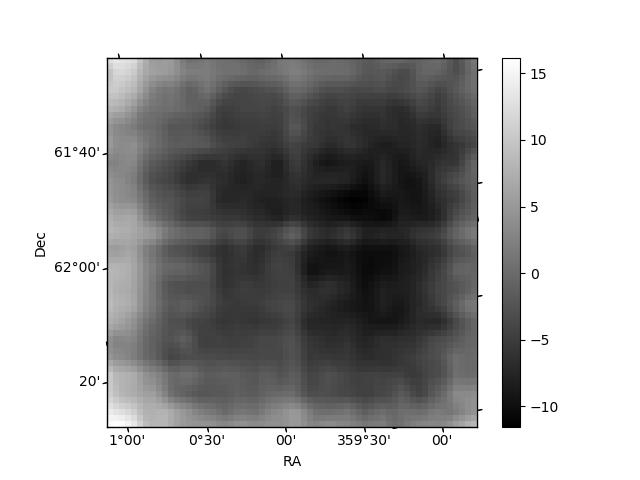
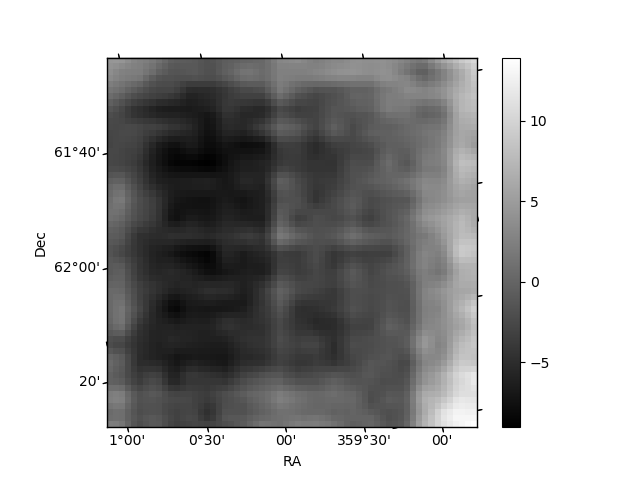
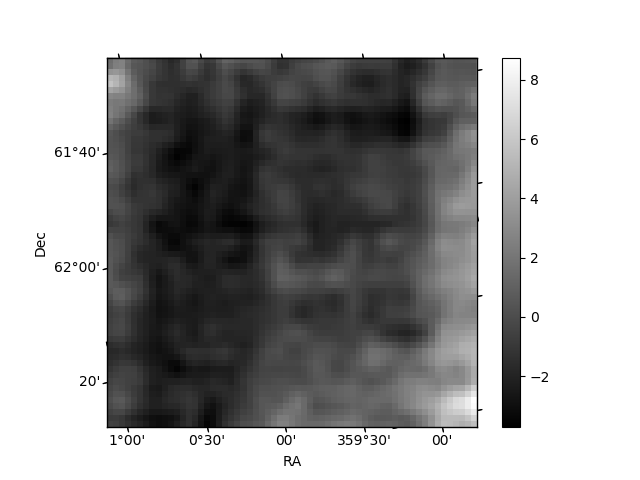
Histogram calculated using DETX and DETY for each event in the final _common_clean file
| Quadrant A | 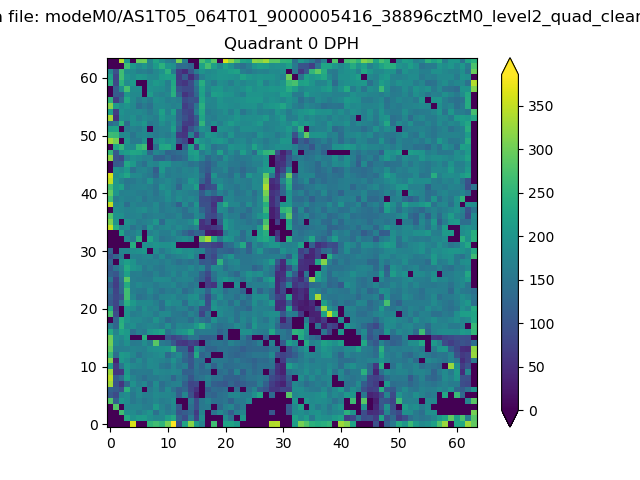 |
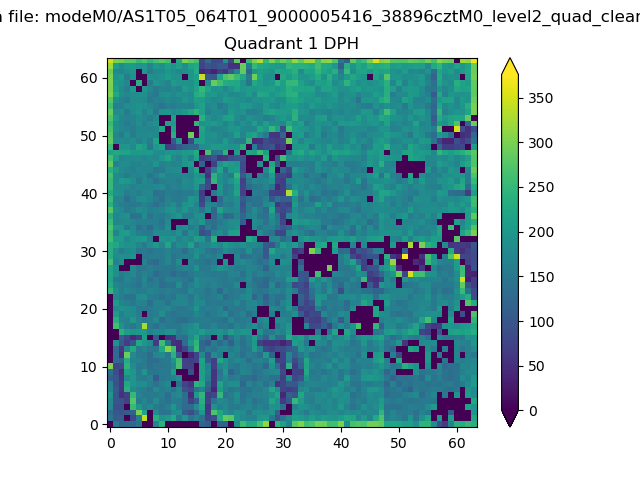 |
Quadrant B |
|---|---|---|---|
| Quadrant D | 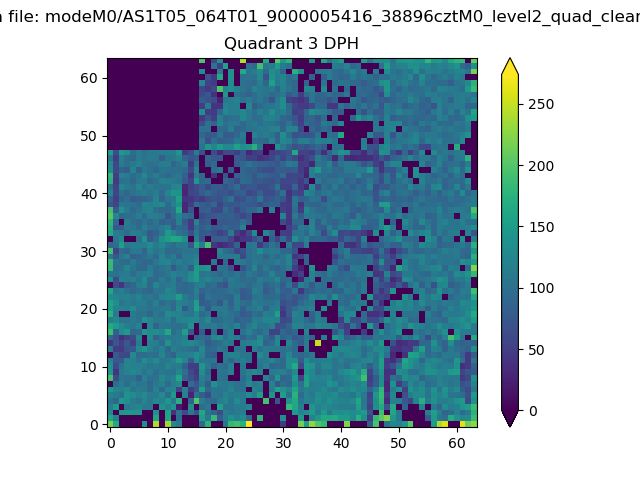 |
 |
Quadrant C |
| Plot type | Count rate plots | Images |
|---|---|---|
| Comparison with Poisson distribution Blue bars denote a histogram of data divided into 1 sec bins. Red curve is a Poisson curve with rate = median count rate of data. |
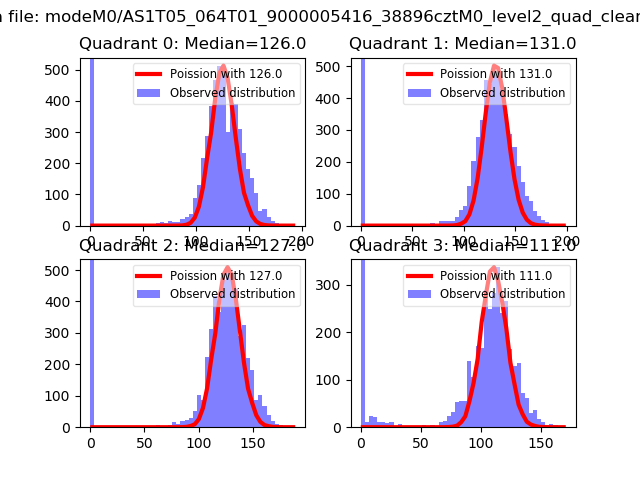 |
 |
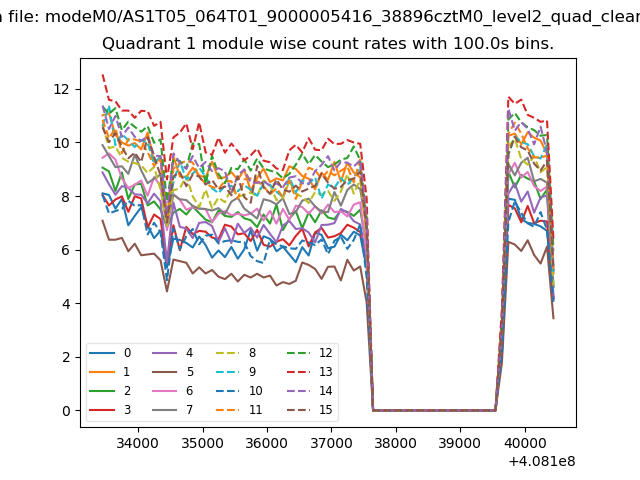
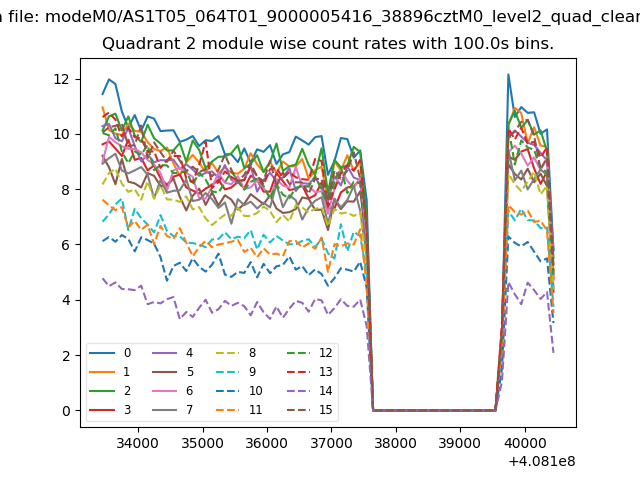
| Quadrant-wise count rates Data is divided into 100 sec bins |
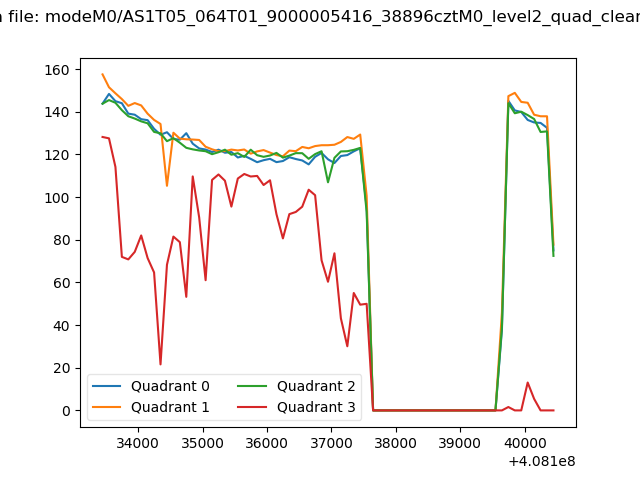 |
|
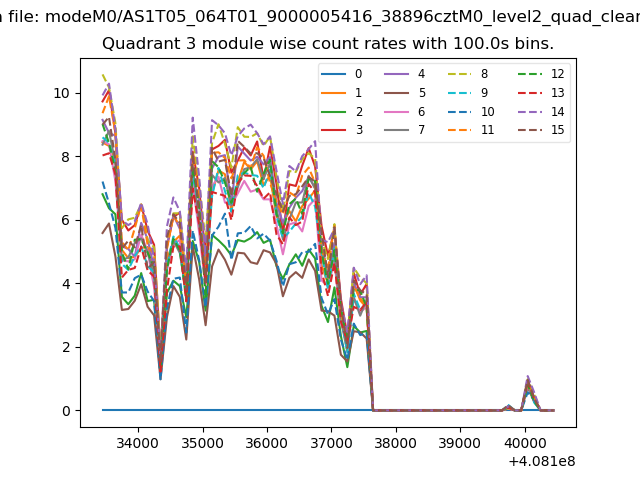
| Module-wise count rates for Quadrant A Data is divided into 100 sec bins |
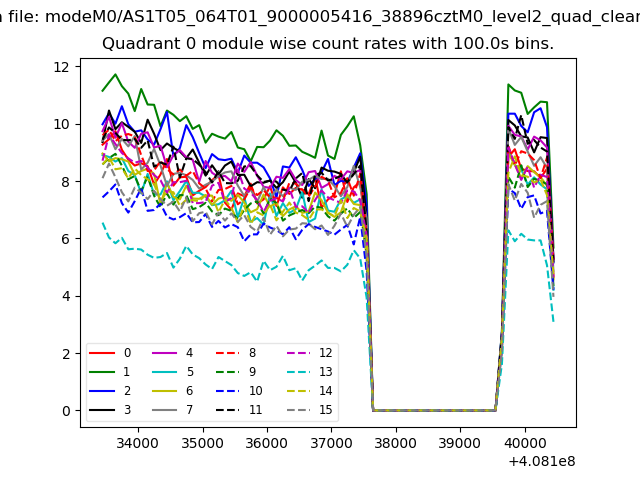 |
 |
| Module-wise count rates for Quadrant B Data is divided into 100 sec bins |
 |
 |
| Module-wise count rates for Quadrant C Data is divided into 100 sec bins |
 |
 |
| Module-wise count rates for Quadrant D Data is divided into 100 sec bins |
 |
 |
| Parameter | Plot |
|---|---|
| CZT HV Monitor | 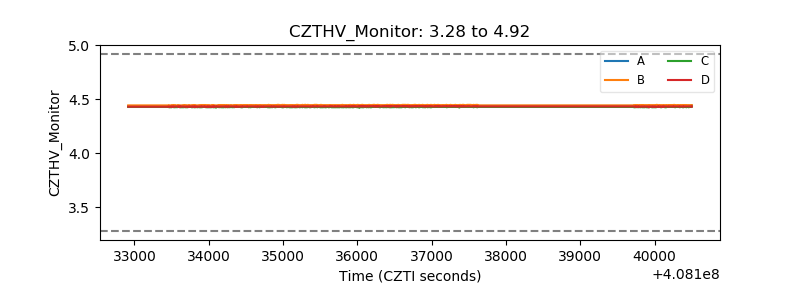 |
| D_VDD | 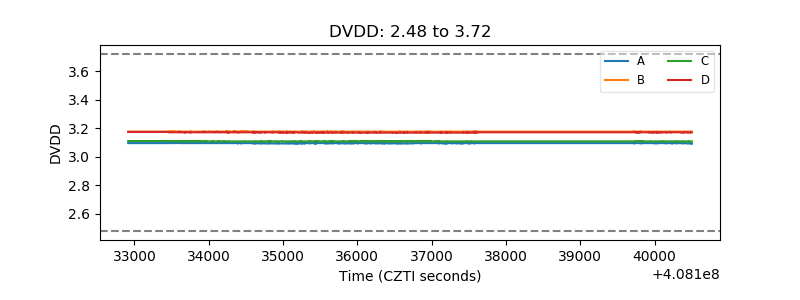 |
| Temperature 1 | 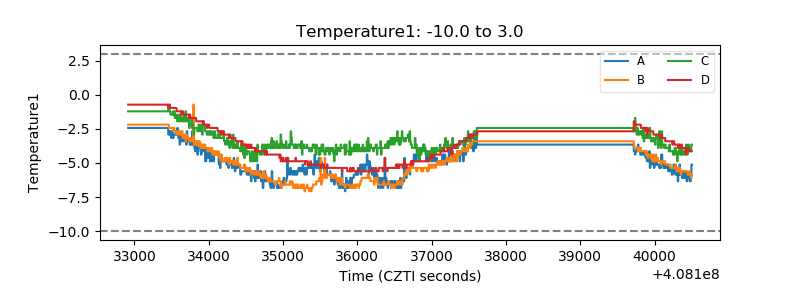 |
| Veto HV Monitor | 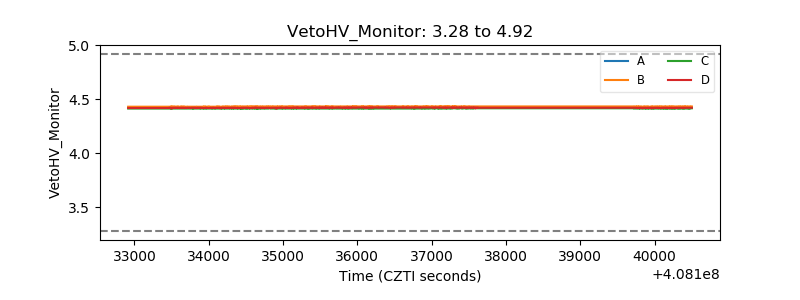 |
| Veto LLD | 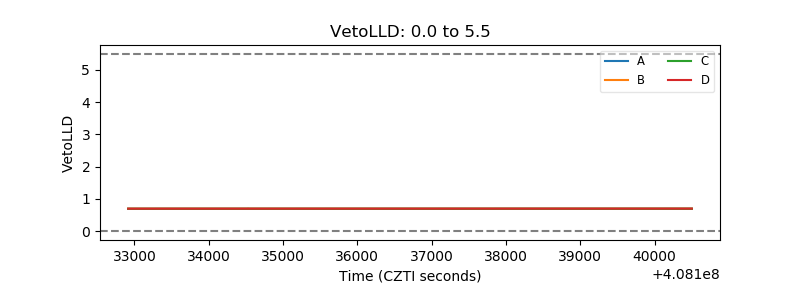 |
| Alpha Counter | 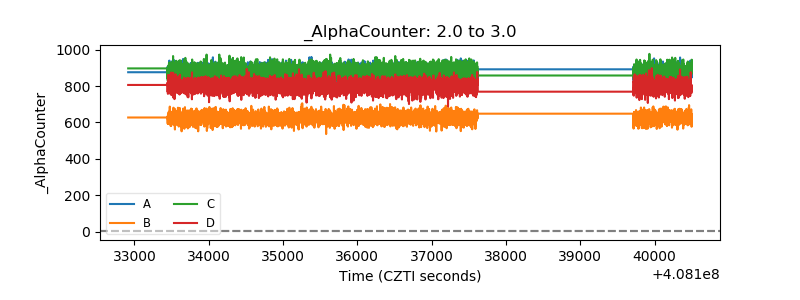 |
| _CPM_Rate | 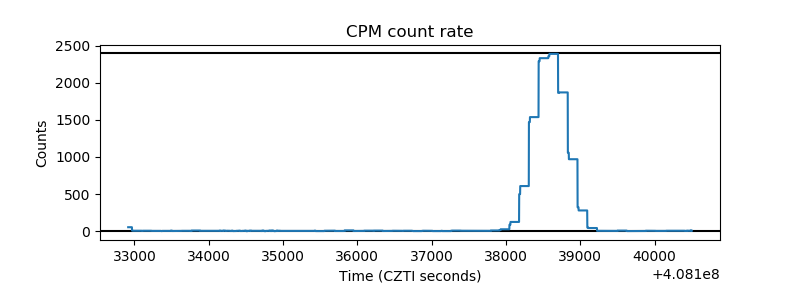 |
| CZT Counter | 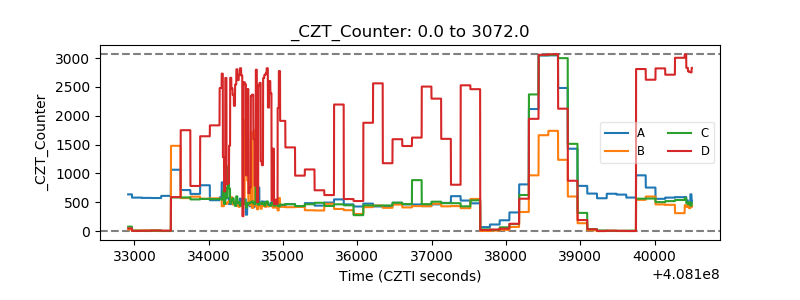 |
| +2.5 Volts monitor | 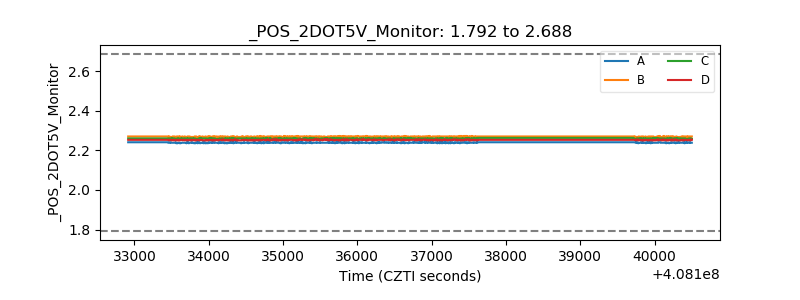 |
| +5 Volts monitor | 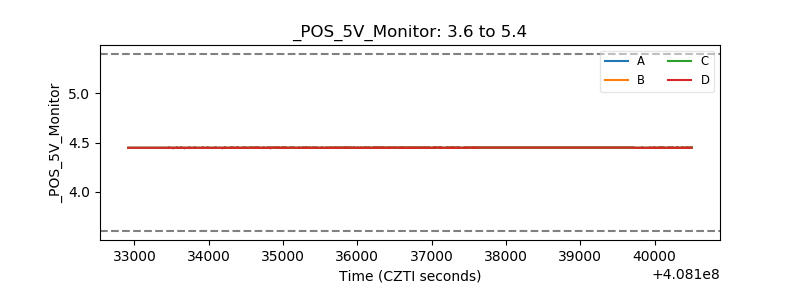 |
| _ROLL_ROT | 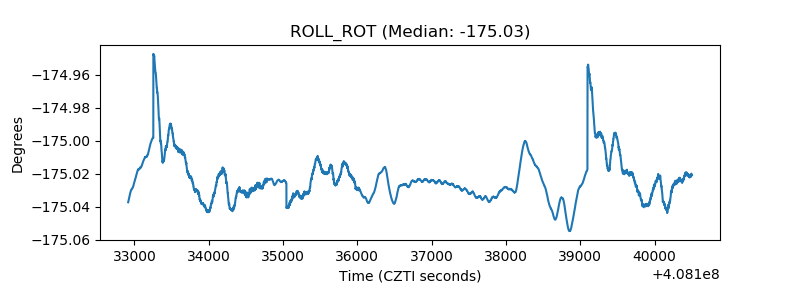 |
| _Roll_DEC | 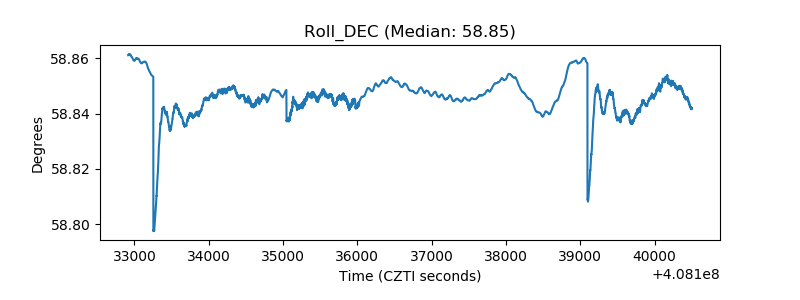 |
| _Roll_RA | 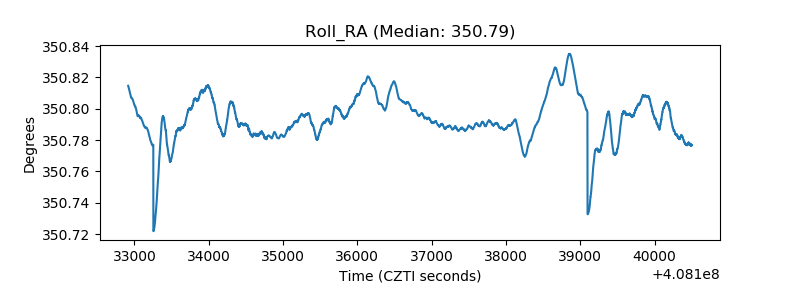 |
| Veto Counter | 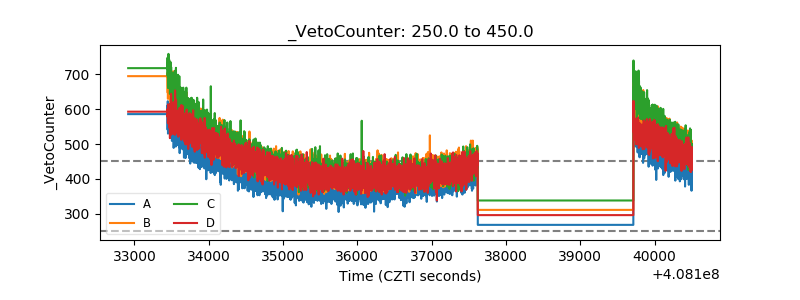 |