| Param | Original file | Final file |
|---|---|---|
| Filename | modeM0/AS1A12_044T04_9000005434_39119cztM0_level2.fits | modeM0/AS1A12_044T04_9000005434_39119cztM0_level2_quad_clean.evt |
| Size (bytes) | 217,393,920 | 48,902,400 |
| Size | 207.3 MB | 46.6 MB |
| Events in quadrant A | 1,565,394 | 333,501 |
| Events in quadrant B | 1,672,151 | 331,749 |
| Events in quadrant C | 1,520,797 | 321,500 |
| Events in quadrant D | 3,058,393 | 283,836 |
| Mode SS | |||
|---|---|---|---|
| Quadrant | BADHDUFLAG | Total packets | Discarded packets |
| A | 0 | 64 | 2 |
| B | 0 | 64 | 2 |
| C | 0 | 64 | 2 |
| D | 0 | 65 | 3 |
| Mode M0 | |||
|---|---|---|---|
| Quadrant | BADHDUFLAG | Total packets | Discarded packets |
| A | 0 | 6570 | 211 |
| B | 0 | 7145 | 225 |
| C | 0 | 6481 | 223 |
| D | 0 | 11430 | 358 |
| Mode M9 | |||
|---|---|---|---|
| Quadrant | BADHDUFLAG | Total packets | Discarded packets |
| A | 0 | 16 | 2 |
| B | 0 | 14 | 0 |
| C | 0 | 14 | 0 |
| D | 0 | 15 | 0 |
| Quadrant | Total seconds | Saturated seconds | Saturation percentage |
|---|---|---|---|
| A | 2951 | 11 | 0.372755% |
| B | 2945 | 89 | 3.022071% |
| C | 2943 | 15 | 0.509684% |
| D | 2935 | 236 | 8.040886% |
Noise dominated data is calculated using 1-second bins in cleaned event files. If a bin has >2000 counts, and if more than 50% of those come from <1% of pixels, then it is considered to be noise-dominated and hence unusable.
| Quadrant | # 1 sec bins | Bins with >0 counts | Bins with >2000 counts | High rate bins dominated by noise | Noise dominated (total time) | Noise dominated (detector-on time) | Marked lightcurve |
|---|---|---|---|---|---|---|---|
| A | 4672 | 2970 | 6 | 6 | 0.13% | 0.20% | 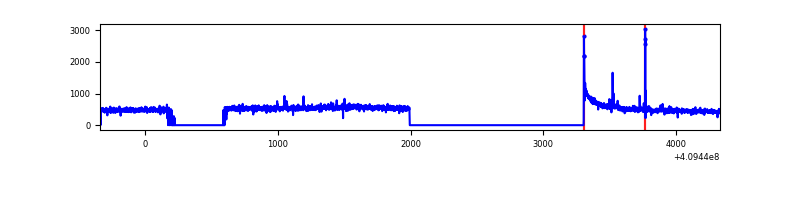 |
| B | 4671 | 2959 | 50 | 50 | 1.07% | 1.69% | 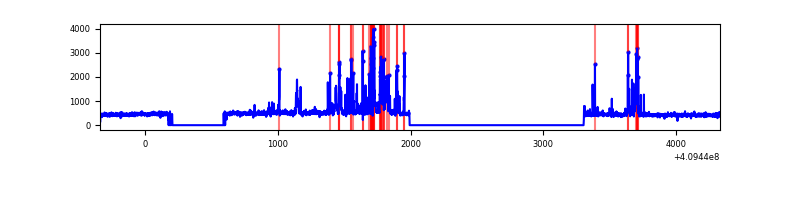 |
| C | 4673 | 2965 | 5 | 5 | 0.11% | 0.17% | 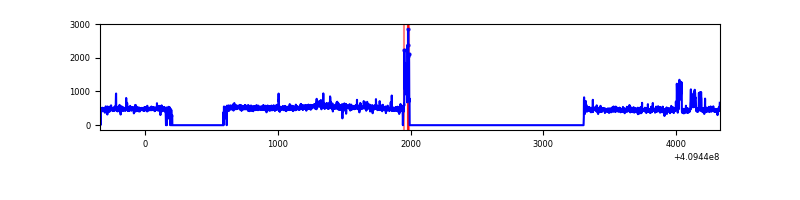 |
| D | 4674 | 2952 | 208 | 208 | 4.45% | 7.05% | 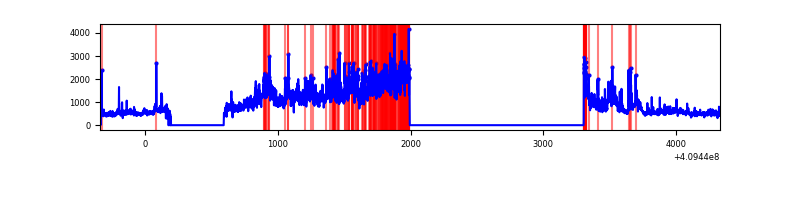 |
Top three noisy pixels from each quadrant. If the there are fewer than three noisy pixels in the level2.evt file, extra rows are filled as -1
| Pixel properties | Quadrant properties | ||||||
|---|---|---|---|---|---|---|---|
| Quadrant | DetID | PixID | Counts | Sigma | Mean | Median | Sigma |
| A | 10 | 83 | 235069 | 3370.21 | 336 | 329 | 69.7 |
| A | 13 | 248 | 18392 | 259.33 | 336 | 329 | 69.7 |
| A | 13 | 254 | 4183 | 55.33 | 336 | 329 | 69.7 |
| B | 5 | 172 | 291947 | 4428.07 | 330 | 320 | 65.9 |
| B | 0 | 186 | 18196 | 271.43 | 330 | 320 | 65.9 |
| B | 0 | 230 | 16824 | 250.6 | 330 | 320 | 65.9 |
| C | 15 | 214 | 124073 | 1617.35 | 324 | 325 | 76.5 |
| C | 9 | 187 | 97162 | 1265.63 | 324 | 325 | 76.5 |
| C | 3 | 233 | 33774 | 437.17 | 324 | 325 | 76.5 |
| D | 12 | 235 | 1474533 | 18325.96 | 320 | 310 | 80.4 |
| D | 1 | 47 | 70833 | 876.67 | 320 | 310 | 80.4 |
| D | 2 | 120 | 63497 | 785.47 | 320 | 310 | 80.4 |
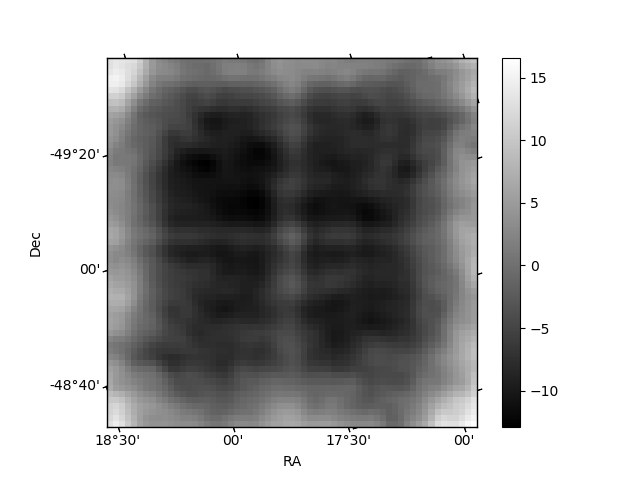
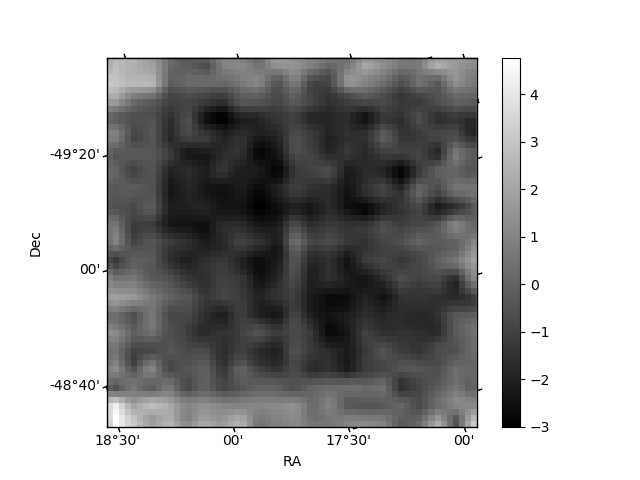
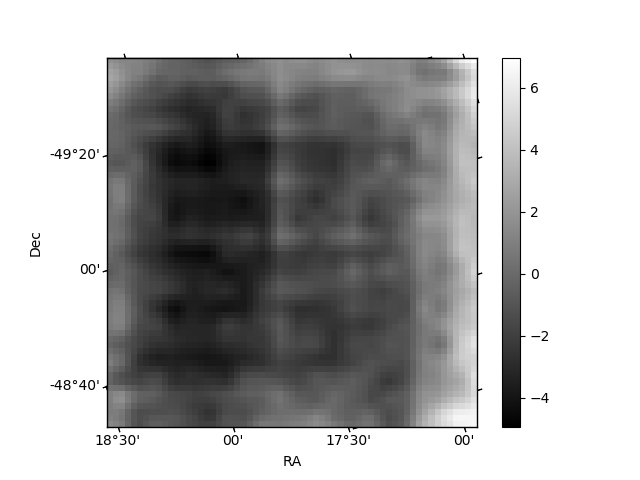
Histogram calculated using DETX and DETY for each event in the final _common_clean file
| Quadrant A | 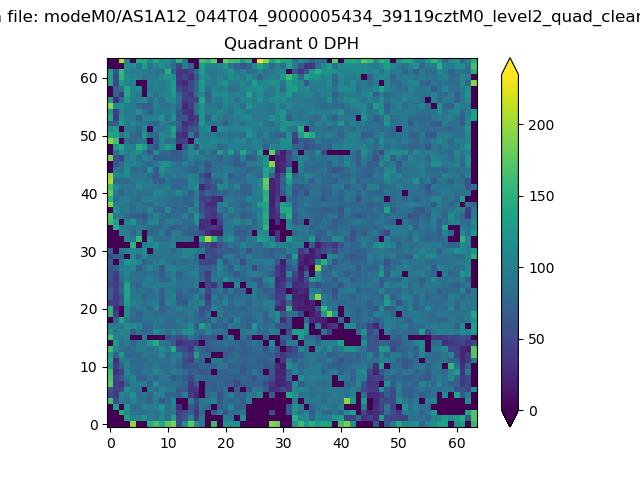 |
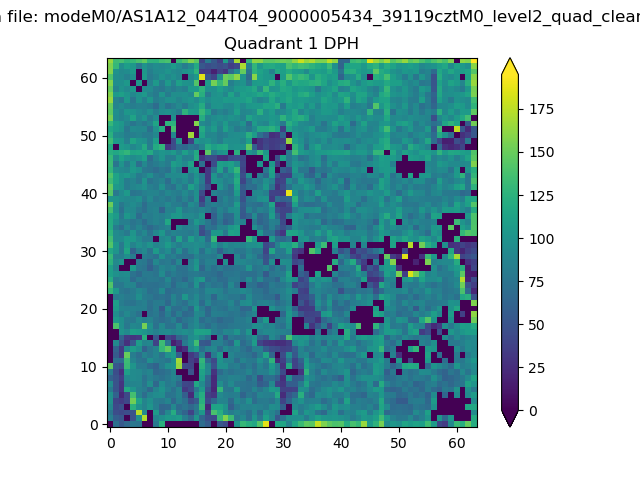 |
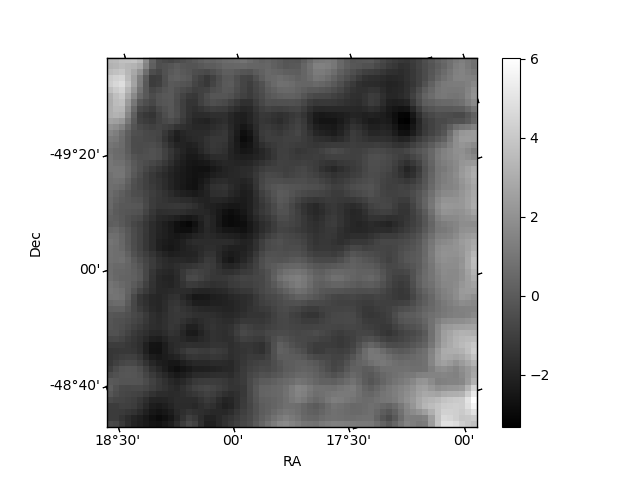
Quadrant B |
|---|---|---|---|
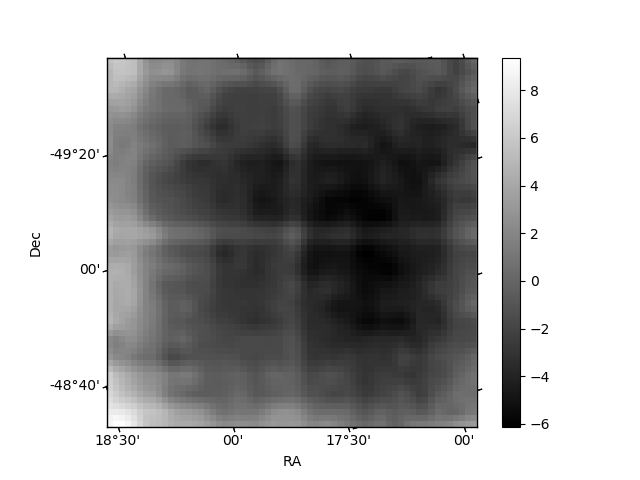
| Quadrant D | 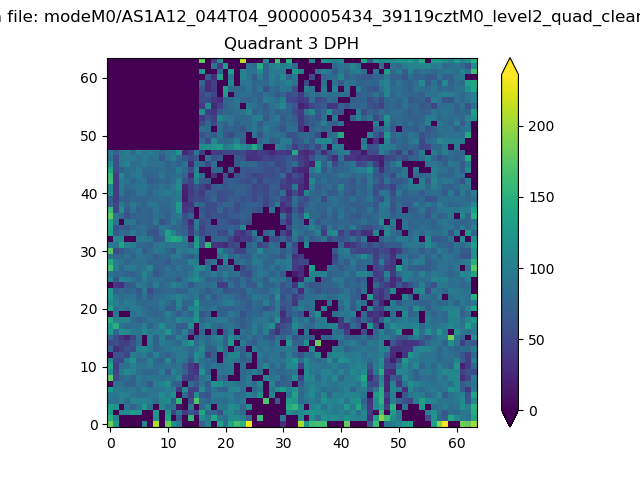 |
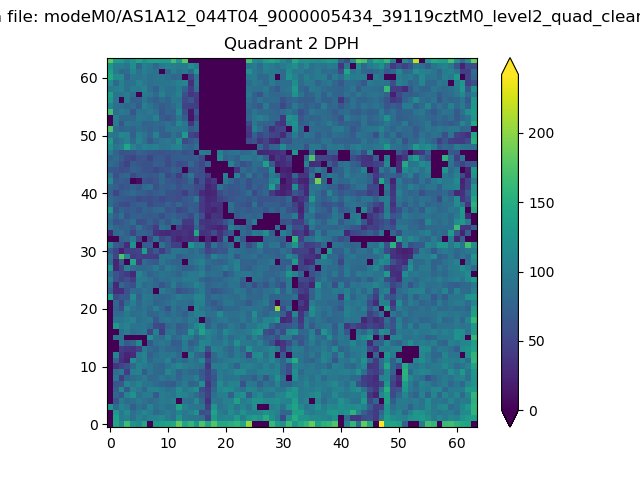 |
Quadrant C |
| Plot type | Count rate plots | Images |
|---|---|---|
| Comparison with Poisson distribution Blue bars denote a histogram of data divided into 1 sec bins. Red curve is a Poisson curve with rate = median count rate of data. |
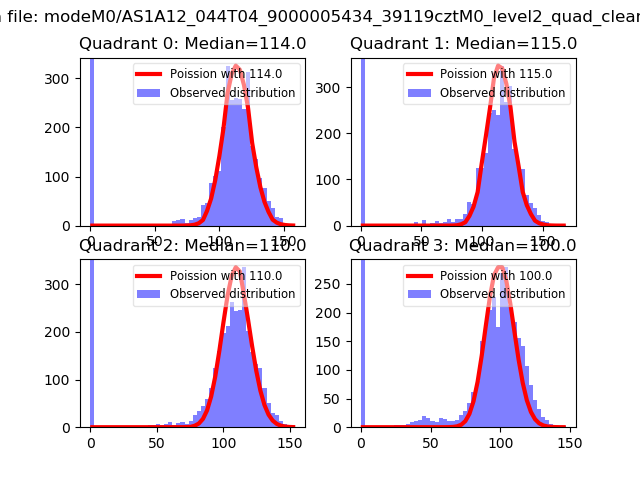 |
 |
| Quadrant-wise count rates Data is divided into 100 sec bins |
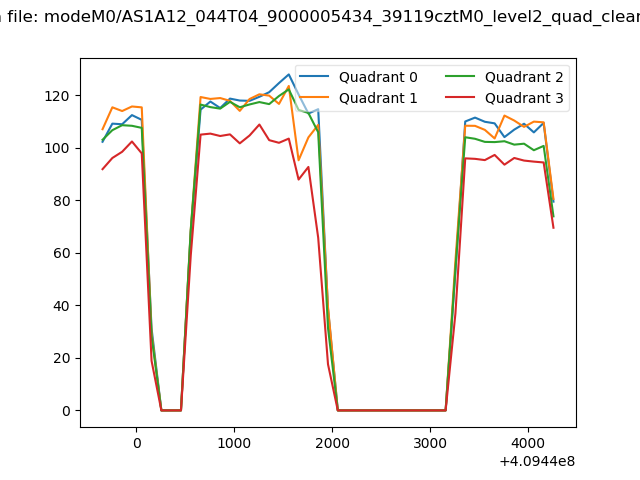 |
|
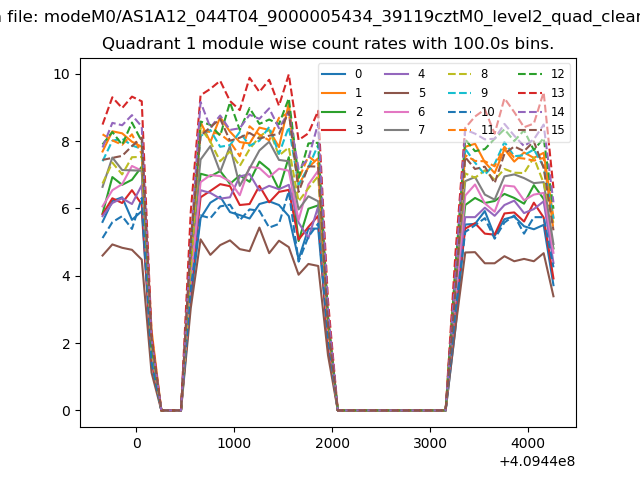
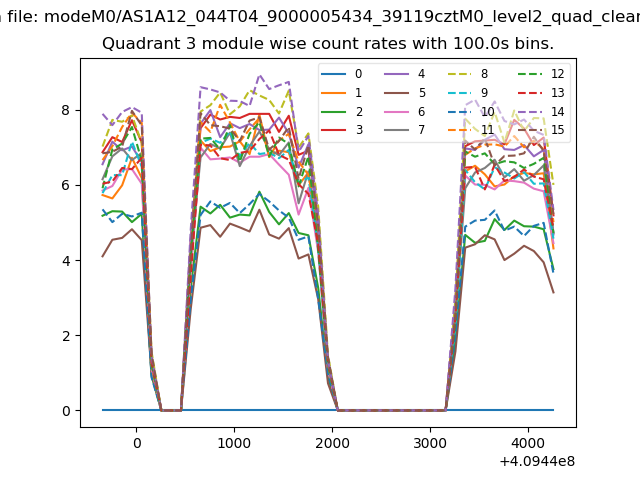
| Module-wise count rates for Quadrant A Data is divided into 100 sec bins |
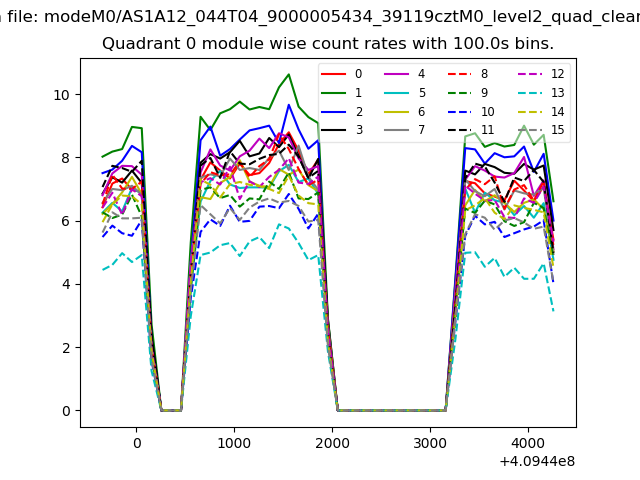 |
 |
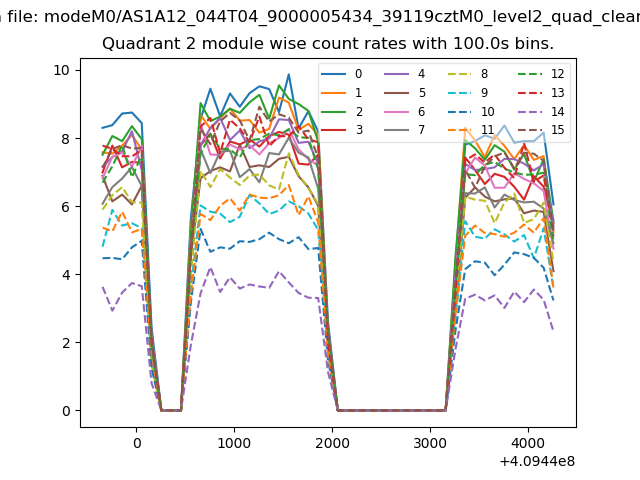
| Module-wise count rates for Quadrant B Data is divided into 100 sec bins |
 |
 |
| Module-wise count rates for Quadrant C Data is divided into 100 sec bins |
 |
 |
| Module-wise count rates for Quadrant D Data is divided into 100 sec bins |
 |
 |
| Parameter | Plot |
|---|---|
| CZT HV Monitor |  |
| D_VDD | 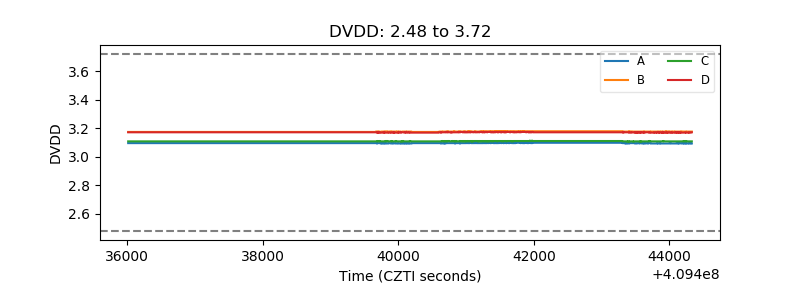 |
| Temperature 1 | 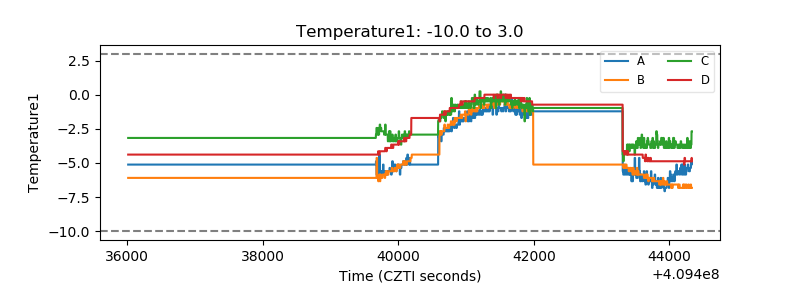 |
| Veto HV Monitor | 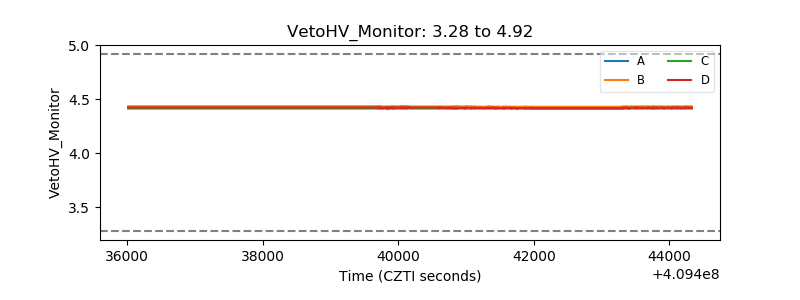 |
| Veto LLD | 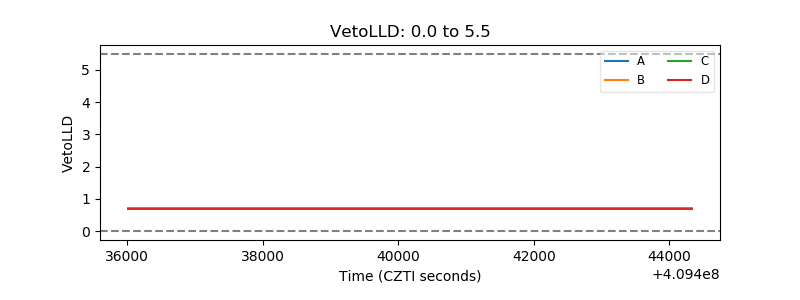 |
| Alpha Counter | 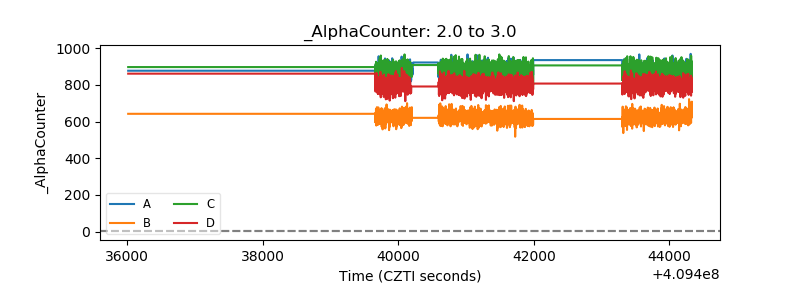 |
| _CPM_Rate | 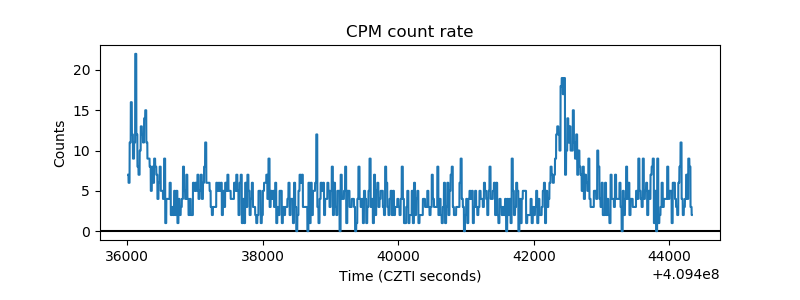 |
| CZT Counter | 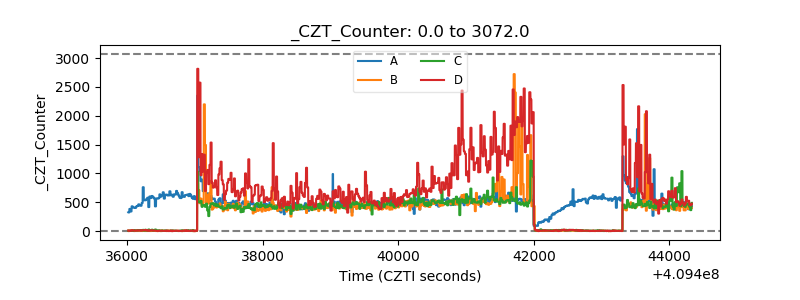 |
| +2.5 Volts monitor | 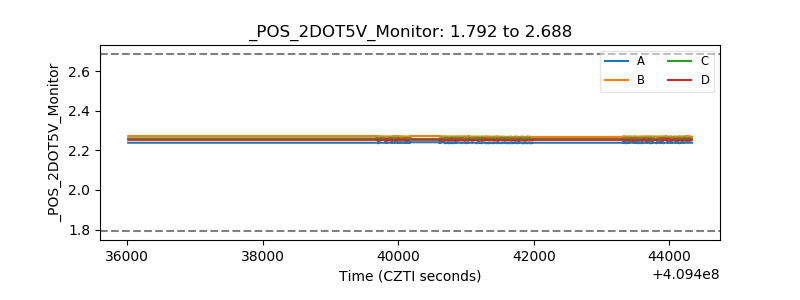 |
| +5 Volts monitor | 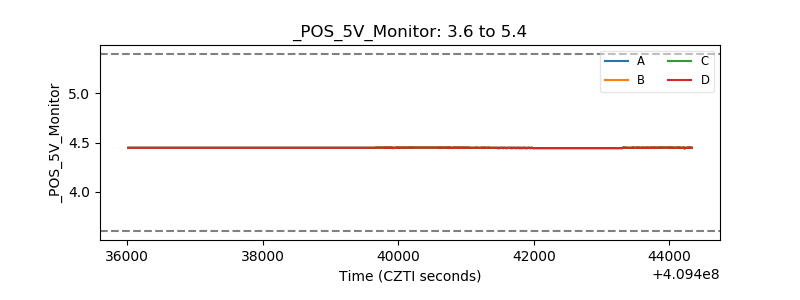 |
| _ROLL_ROT | 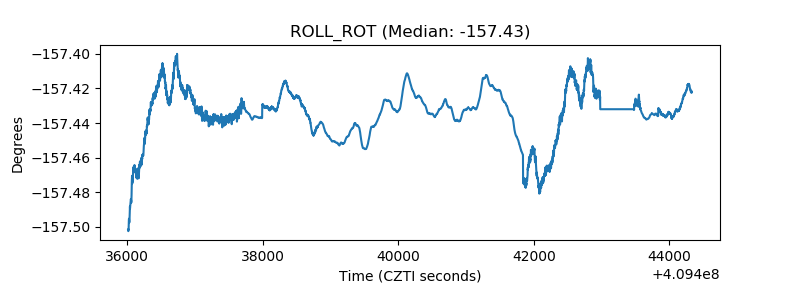 |
| _Roll_DEC | 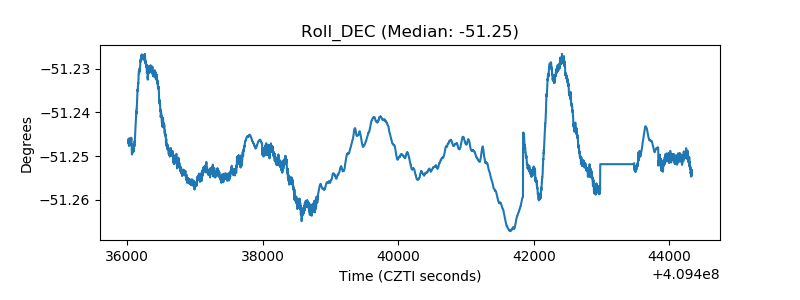 |
| _Roll_RA | 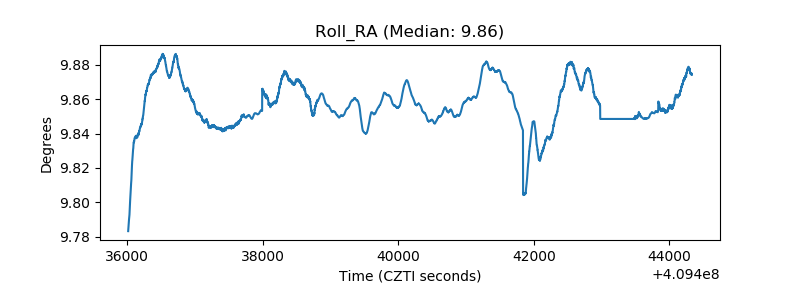 |
| Veto Counter | 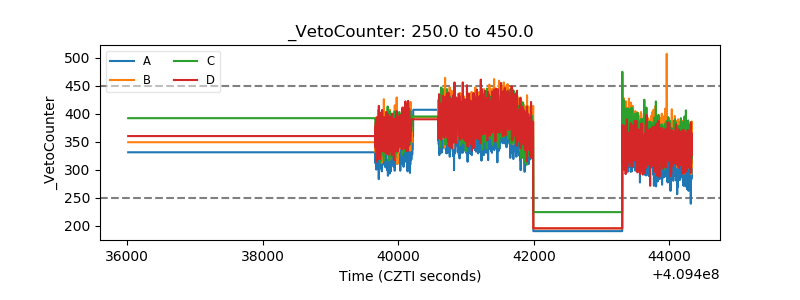 |