| Param | Original file | Final file |
|---|---|---|
| Filename | modeM0/AS1A12_044T16_9000005442_39144cztM0_level2.fits | modeM0/AS1A12_044T16_9000005442_39144cztM0_level2_quad_clean.evt |
| Size (bytes) | 215,832,960 | 55,056,960 |
| Size | 205.8 MB | 52.5 MB |
| Events in quadrant A | 1,627,353 | 380,578 |
| Events in quadrant B | 1,408,909 | 384,313 |
| Events in quadrant C | 1,455,267 | 362,071 |
| Events in quadrant D | 3,264,187 | 327,713 |
| Mode M0 | |||
|---|---|---|---|
| Quadrant | BADHDUFLAG | Total packets | Discarded packets |
| A | 0 | 6618 | 1 |
| B | 0 | 6144 | 1 |
| C | 0 | 6187 | 1 |
| D | 0 | 11870 | 1 |
| Mode M9 | |||
|---|---|---|---|
| Quadrant | BADHDUFLAG | Total packets | Discarded packets |
| A | 0 | 21 | 0 |
| B | 0 | 21 | 0 |
| C | 0 | 21 | 0 |
| D | 0 | 21 | 0 |
| Mode SS | |||
|---|---|---|---|
| Quadrant | BADHDUFLAG | Total packets | Discarded packets |
| A | 0 | 62 | 0 |
| B | 0 | 62 | 0 |
| C | 0 | 62 | 0 |
| D | 0 | 62 | 0 |
| Quadrant | Total seconds | Saturated seconds | Saturation percentage |
|---|---|---|---|
| A | 2984 | 11 | 0.368633% |
| B | 2984 | 5 | 0.167560% |
| C | 2984 | 3 | 0.100536% |
| D | 2984 | 159 | 5.328418% |
Noise dominated data is calculated using 1-second bins in cleaned event files. If a bin has >2000 counts, and if more than 50% of those come from <1% of pixels, then it is considered to be noise-dominated and hence unusable.
| Quadrant | # 1 sec bins | Bins with >0 counts | Bins with >2000 counts | High rate bins dominated by noise | Noise dominated (total time) | Noise dominated (detector-on time) | Marked lightcurve |
|---|---|---|---|---|---|---|---|
| A | 5107 | 2985 | 2 | 2 | 0.04% | 0.07% | 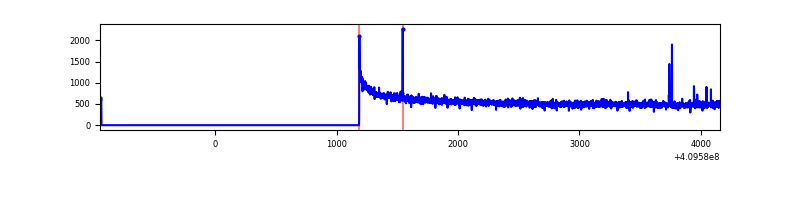 |
| B | 5107 | 2985 | 3 | 3 | 0.06% | 0.10% | 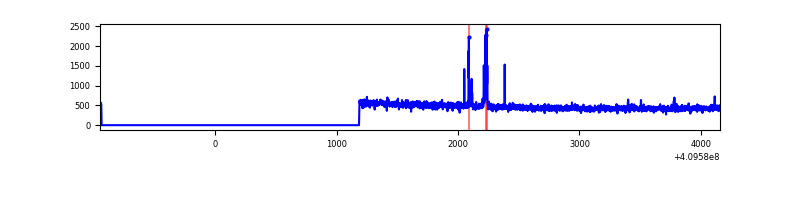 |
| C | 5107 | 2985 | 1 | 1 | 0.02% | 0.03% | 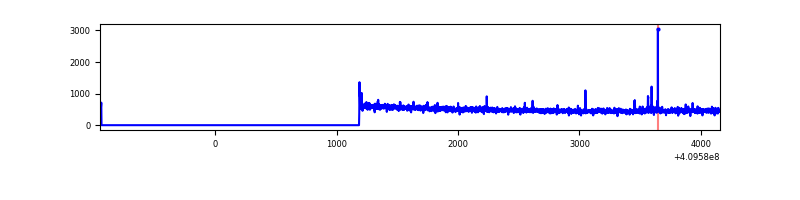 |
| D | 5107 | 2985 | 244 | 244 | 4.78% | 8.17% | 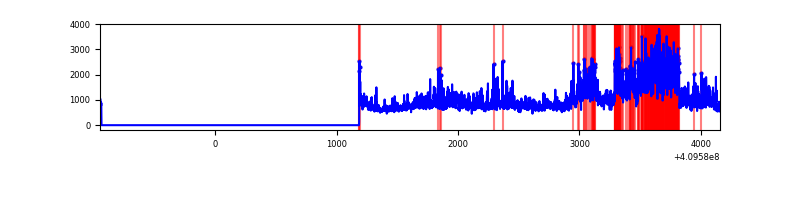 |
Top three noisy pixels from each quadrant. If the there are fewer than three noisy pixels in the level2.evt file, extra rows are filled as -1
| Pixel properties | Quadrant properties | ||||||
|---|---|---|---|---|---|---|---|
| Quadrant | DetID | PixID | Counts | Sigma | Mean | Median | Sigma |
| A | 10 | 83 | 209709 | 2950.05 | 352 | 347 | 71.0 |
| A | 15 | 223 | 44840 | 626.94 | 352 | 347 | 71.0 |
| A | 9 | 143 | 10850 | 147.99 | 352 | 347 | 71.0 |
| B | 5 | 172 | 40535 | 590.76 | 346 | 337 | 68.0 |
| B | 12 | 111 | 8222 | 115.88 | 346 | 337 | 68.0 |
| B | 11 | 111 | 7766 | 109.18 | 346 | 337 | 68.0 |
| C | 15 | 214 | 125921 | 1606.25 | 332 | 335 | 78.2 |
| C | 9 | 187 | 20457 | 257.36 | 332 | 335 | 78.2 |
| C | 0 | 239 | 9150 | 112.74 | 332 | 335 | 78.2 |
| D | 12 | 235 | 1787829 | 22186.06 | 330 | 321 | 80.6 |
| D | 5 | 222 | 86426 | 1068.71 | 330 | 321 | 80.6 |
| D | 2 | 250 | 79325 | 980.58 | 330 | 321 | 80.6 |
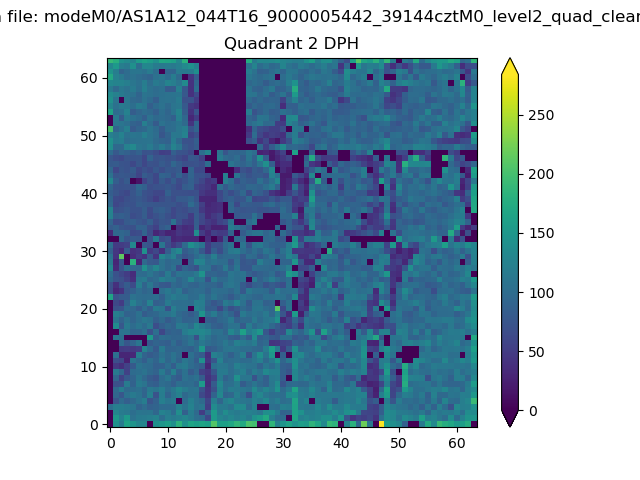
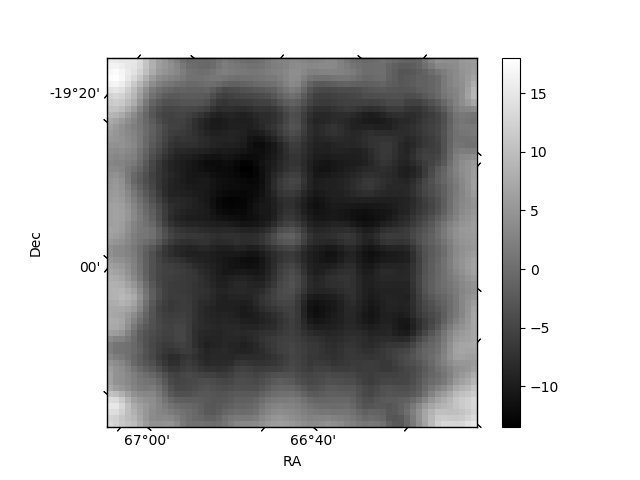
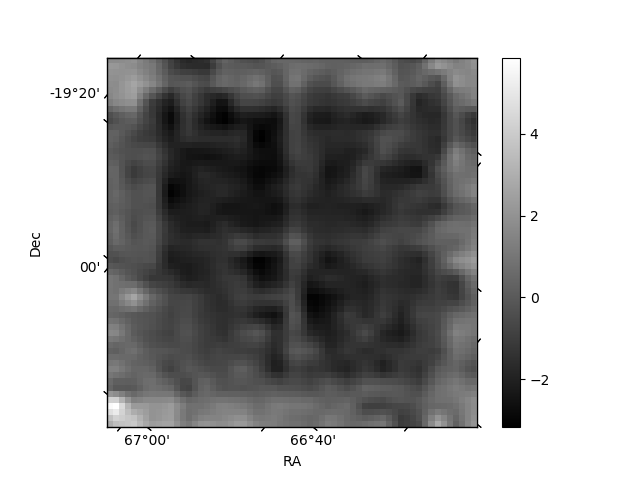
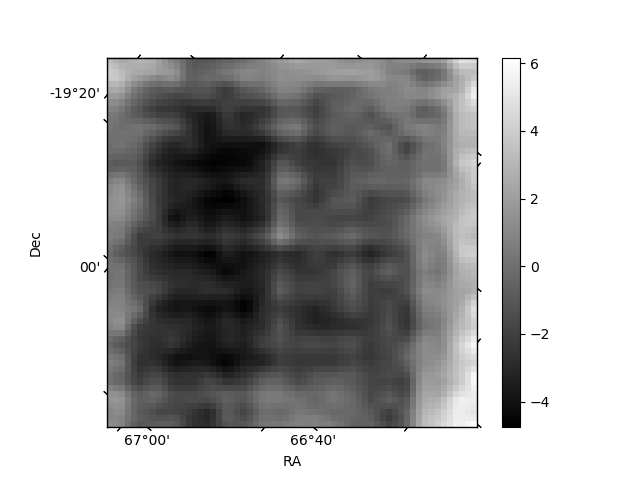
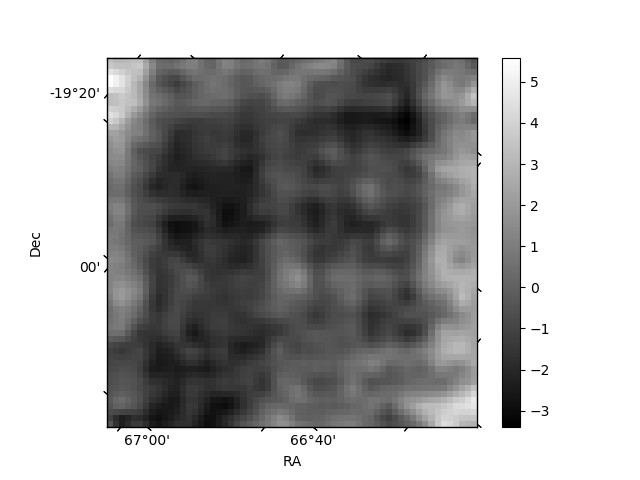
Histogram calculated using DETX and DETY for each event in the final _common_clean file
| Quadrant A | 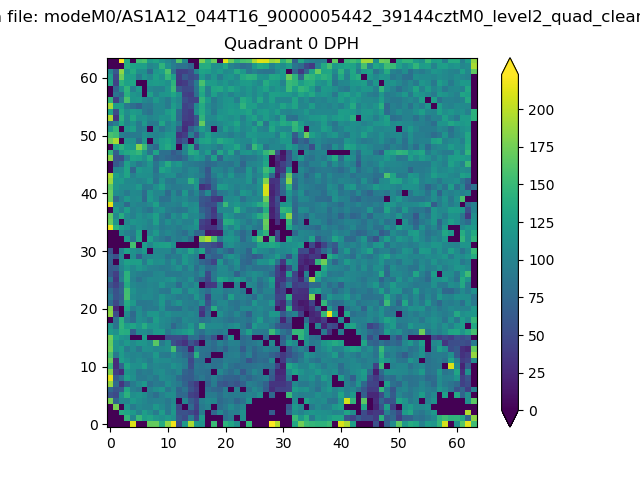 |
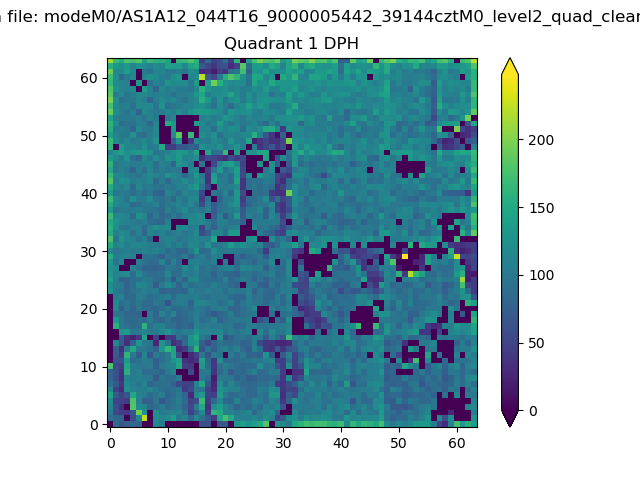 |
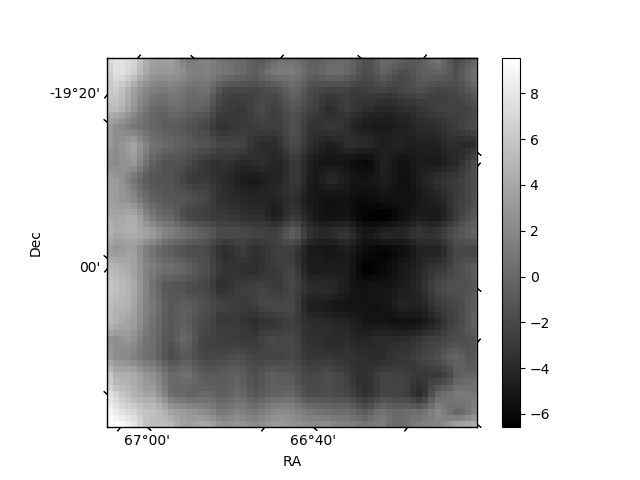
Quadrant B |
|---|---|---|---|
| Quadrant D | 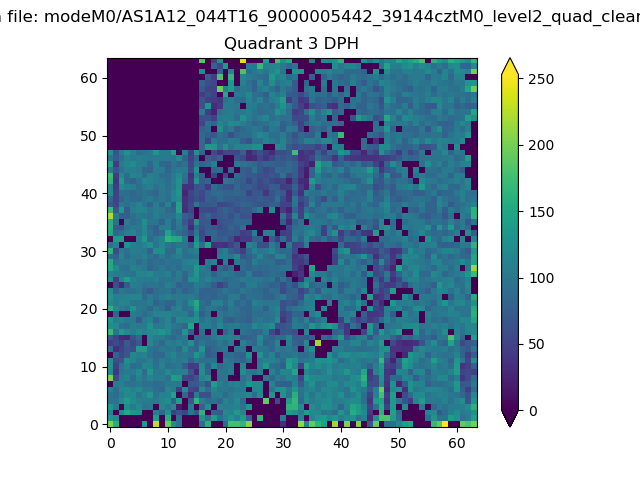 |
 |
Quadrant C |
| Plot type | Count rate plots | Images |
|---|---|---|
| Comparison with Poisson distribution Blue bars denote a histogram of data divided into 1 sec bins. Red curve is a Poisson curve with rate = median count rate of data. |
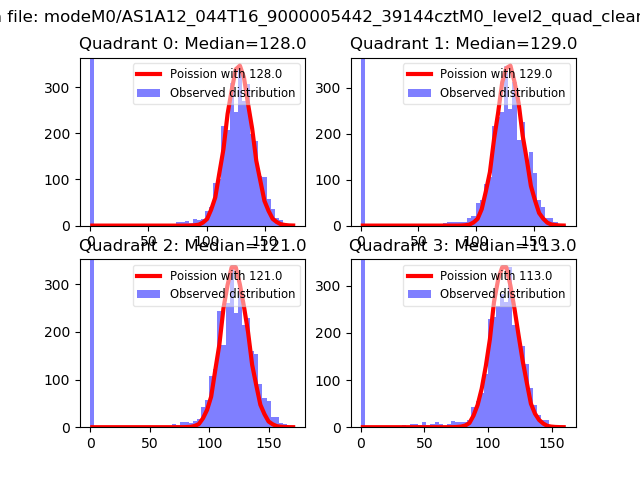 |
 |
| Quadrant-wise count rates Data is divided into 100 sec bins |
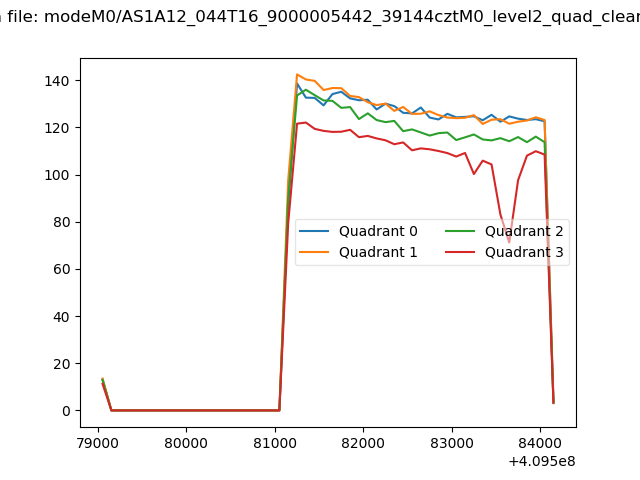 |
|
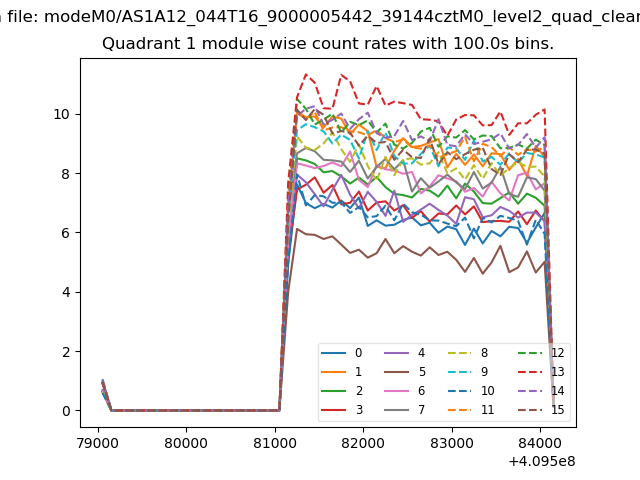
| Module-wise count rates for Quadrant A Data is divided into 100 sec bins |
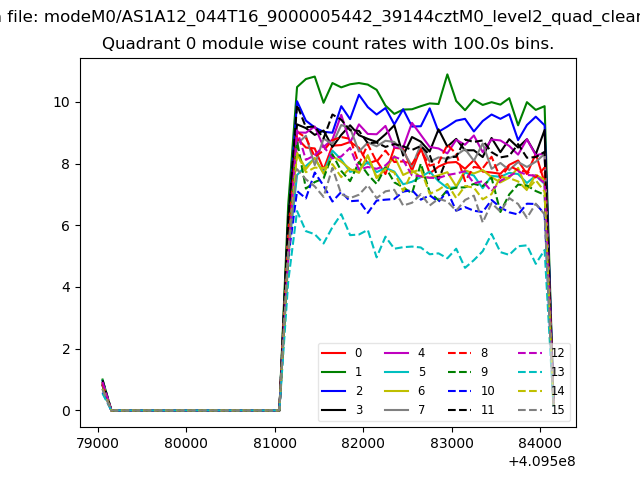 |
 |
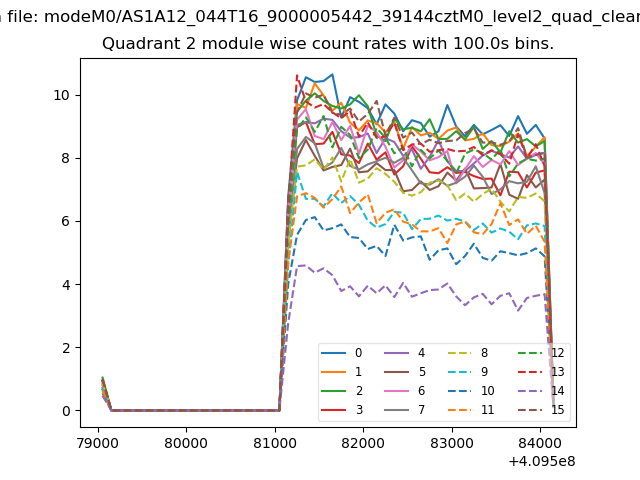
| Module-wise count rates for Quadrant B Data is divided into 100 sec bins |
 |
 |
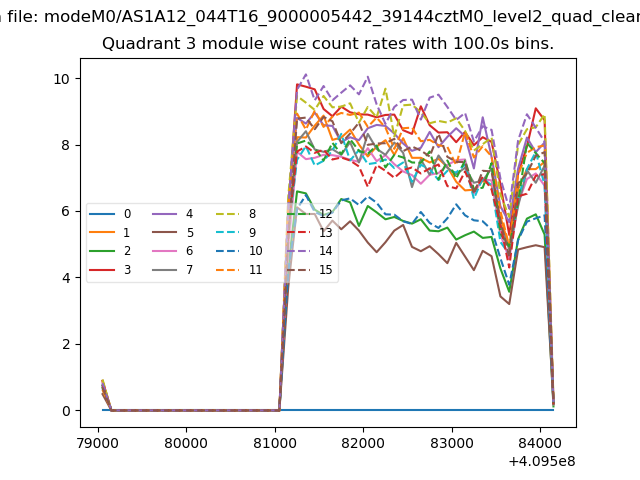
| Module-wise count rates for Quadrant C Data is divided into 100 sec bins |
 |
 |
| Module-wise count rates for Quadrant D Data is divided into 100 sec bins |
 |
 |
| Parameter | Plot |
|---|---|
| CZT HV Monitor | 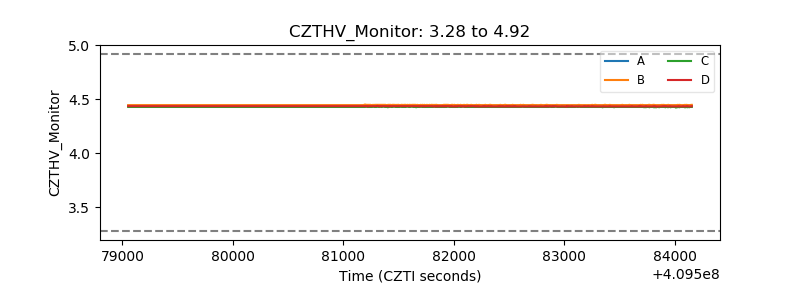 |
| D_VDD | 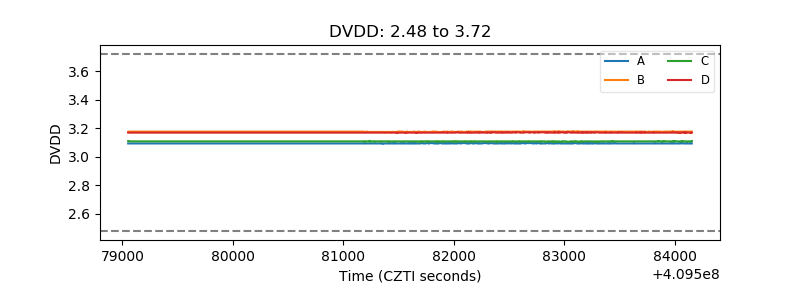 |
| Temperature 1 | 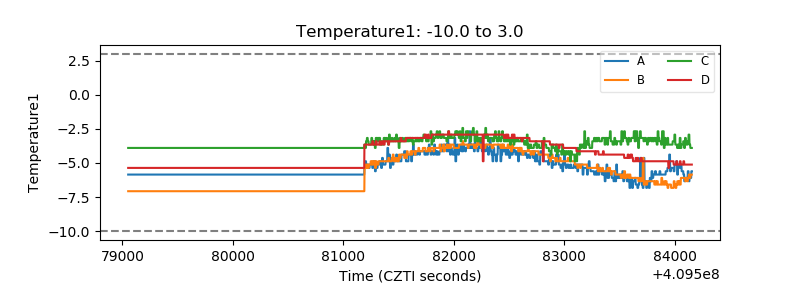 |
| Veto HV Monitor | 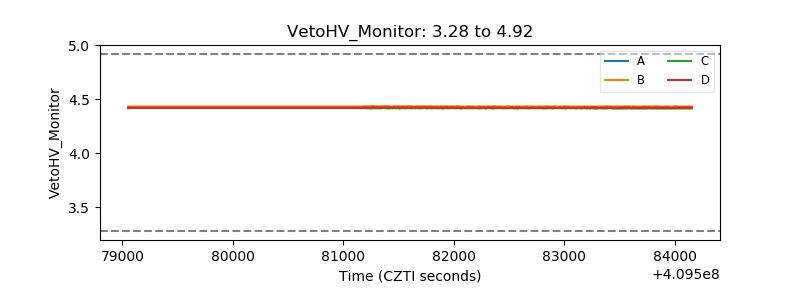 |
| Veto LLD | 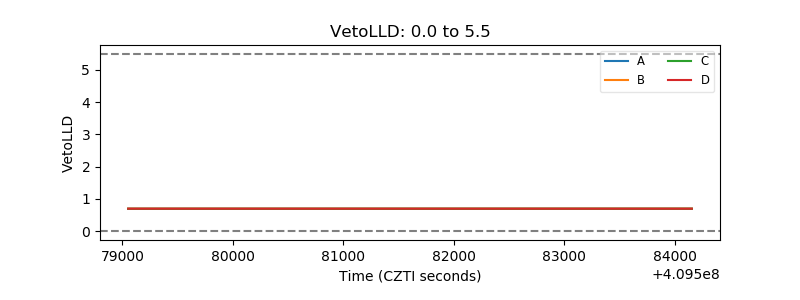 |
| Alpha Counter | 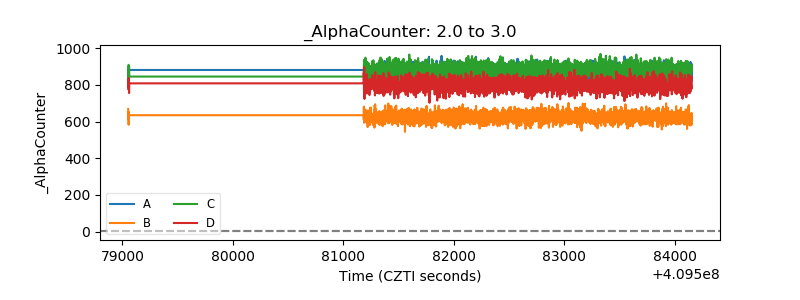 |
| _CPM_Rate | 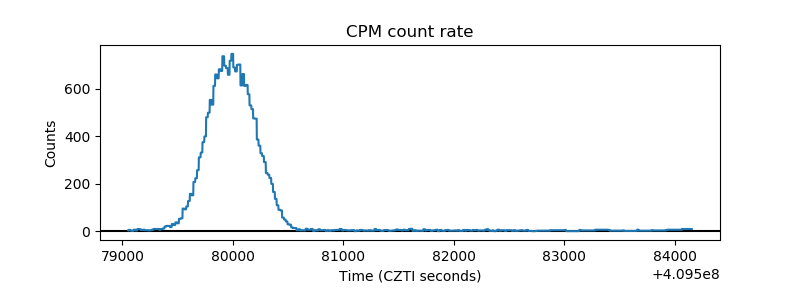 |
| CZT Counter | 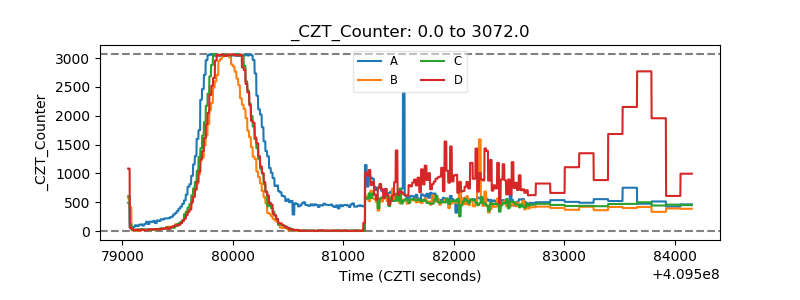 |
| +2.5 Volts monitor | 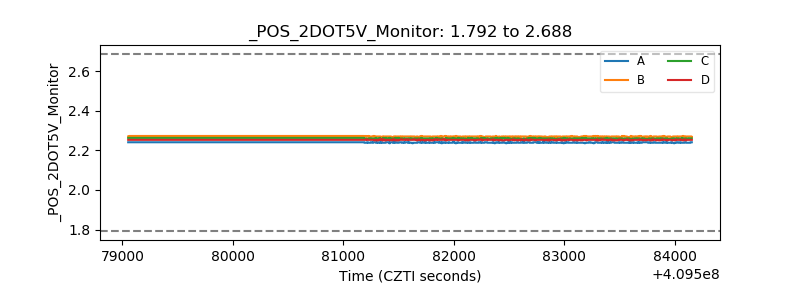 |
| +5 Volts monitor | 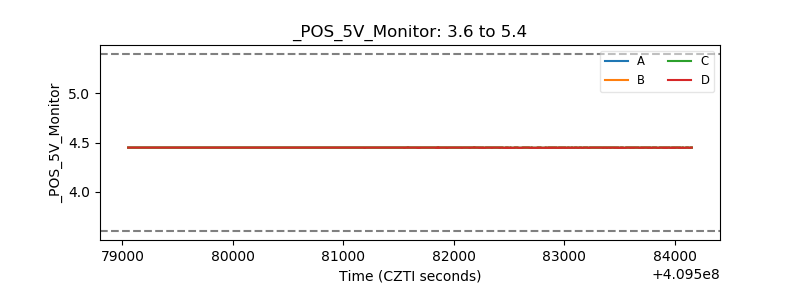 |
| _ROLL_ROT | 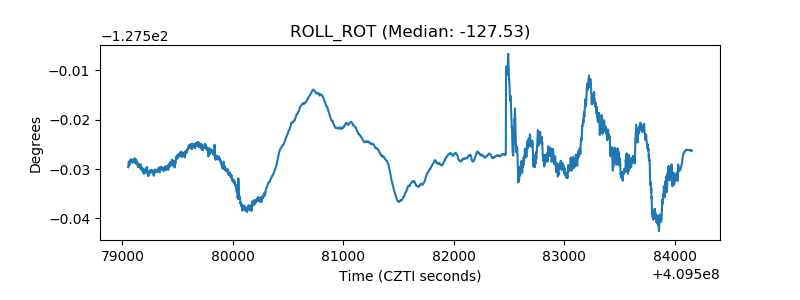 |
| _Roll_DEC | 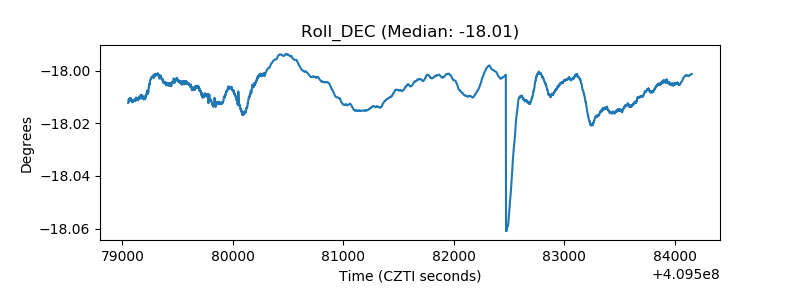 |
| _Roll_RA | 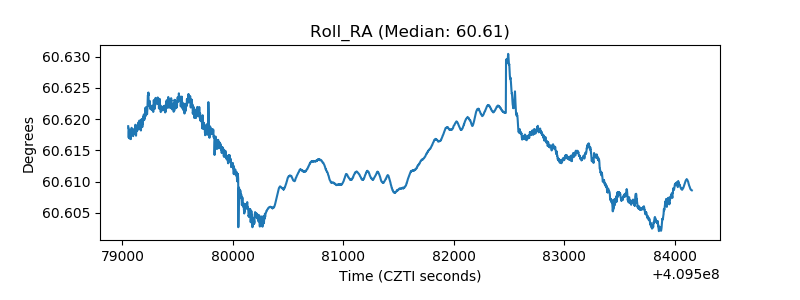 |
| Veto Counter | 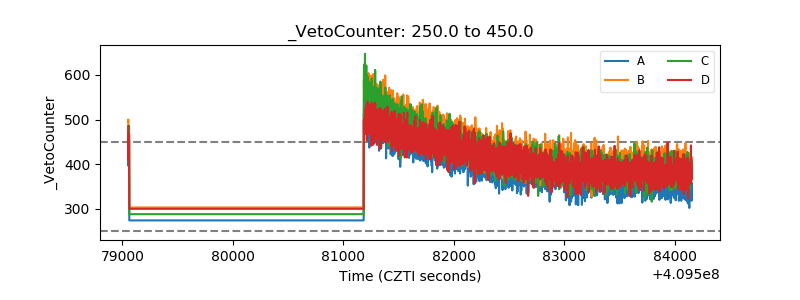 |