| Param | Original file | Final file |
|---|---|---|
| Filename | modeM0/AS1A12_044T21_9000005512_39939cztM0_level2.fits | modeM0/AS1A12_044T21_9000005512_39939cztM0_level2_quad_clean.evt |
| Size (bytes) | 18,129,600 | 5,068,800 |
| Size | 17.3 MB | 4.8 MB |
| Events in quadrant A | 177,626 | 27,077 |
| Events in quadrant B | 149,452 | 31,425 |
| Events in quadrant C | 169,979 | 23,087 |
| Events in quadrant D | 147,822 | 23,297 |
| Mode M9 | |||
|---|---|---|---|
| Quadrant | BADHDUFLAG | Total packets | Discarded packets |
| A | 0 | 28 | 0 |
| B | 0 | 28 | 0 |
| C | 0 | 28 | 0 |
| D | 0 | 29 | 0 |
| Mode SS | |||
|---|---|---|---|
| Quadrant | BADHDUFLAG | Total packets | Discarded packets |
| A | 0 | 100 | 0 |
| B | 0 | 100 | 0 |
| C | 0 | 100 | 0 |
| D | 0 | 100 | 0 |
| Mode M0 | |||
|---|---|---|---|
| Quadrant | BADHDUFLAG | Total packets | Discarded packets |
| A | 0 | 4923 | 4234 |
| B | 0 | 6484 | 5853 |
| C | 0 | 5230 | 4553 |
| D | 0 | 5666 | 5045 |
| Quadrant | Total seconds | Saturated seconds | Saturation percentage |
|---|---|---|---|
| A | 290 | 1 | 0.344828% |
| B | 309 | 1 | 0.323625% |
| C | 270 | 2 | 0.740741% |
| D | 283 | 1 | 0.353357% |
Noise dominated data is calculated using 1-second bins in cleaned event files. If a bin has >2000 counts, and if more than 50% of those come from <1% of pixels, then it is considered to be noise-dominated and hence unusable.
| Quadrant | # 1 sec bins | Bins with >0 counts | Bins with >2000 counts | High rate bins dominated by noise | Noise dominated (total time) | Noise dominated (detector-on time) | Marked lightcurve |
|---|---|---|---|---|---|---|---|
| A | 6591 | 417 | 0 | 0 | 0.00% | 0.00% |  |
| B | 6595 | 430 | 0 | 0 | 0.00% | 0.00% |  |
| C | 6586 | 389 | 1 | 1 | 0.02% | 0.26% | 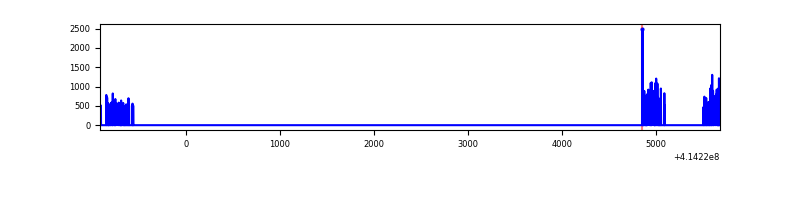 |
| D | 6597 | 412 | 0 | 0 | 0.00% | 0.00% | 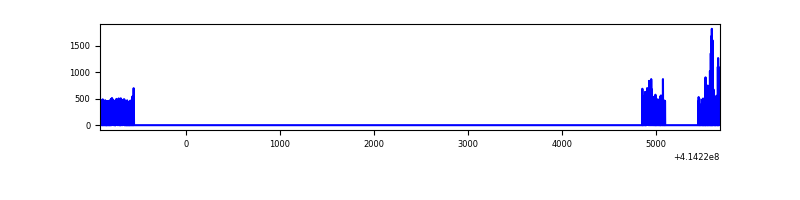 |
Top three noisy pixels from each quadrant. If the there are fewer than three noisy pixels in the level2.evt file, extra rows are filled as -1
| Pixel properties | Quadrant properties | ||||||
|---|---|---|---|---|---|---|---|
| Quadrant | DetID | PixID | Counts | Sigma | Mean | Median | Sigma |
| A | 10 | 83 | 42114 | 4609.76 | 34 | 34 | 9.1 |
| A | 7 | 191 | 583 | 60.14 | 34 | 34 | 9.1 |
| A | 3 | 137 | 355 | 35.16 | 34 | 34 | 9.1 |
| B | 5 | 255 | 4790 | 528.2 | 36 | 35 | 9.0 |
| B | 0 | 183 | 1233 | 133.08 | 36 | 35 | 9.0 |
| B | 12 | 111 | 816 | 86.76 | 36 | 35 | 9.0 |
| C | 9 | 54 | 35028 | 3954.85 | 30 | 30 | 8.8 |
| C | 15 | 214 | 12238 | 1379.53 | 30 | 30 | 8.8 |
| C | 0 | 10 | 2358 | 263.07 | 30 | 30 | 8.8 |
| D | 12 | 227 | 9642 | 973.3 | 32 | 31 | 9.9 |
| D | 2 | 249 | 9530 | 961.95 | 32 | 31 | 9.9 |
| D | 3 | 238 | 1682 | 167.2 | 32 | 31 | 9.9 |
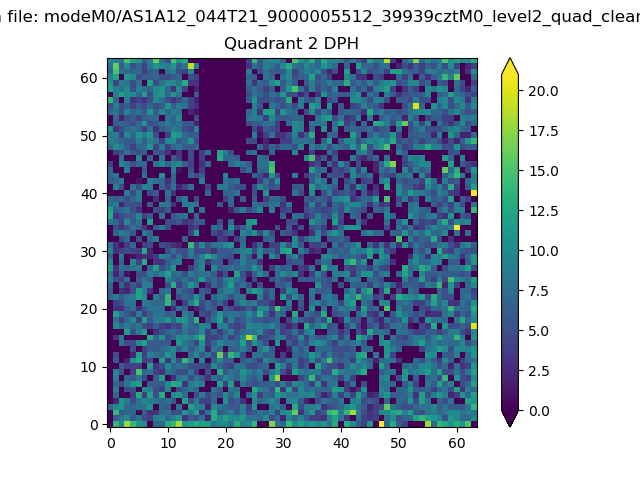
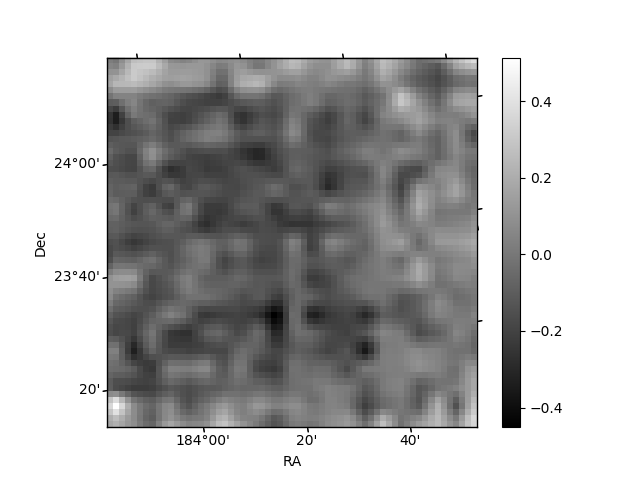
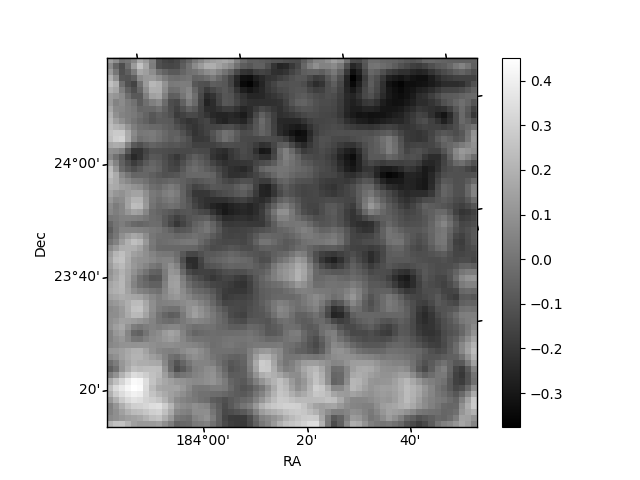
Histogram calculated using DETX and DETY for each event in the final _common_clean file
| Quadrant A | 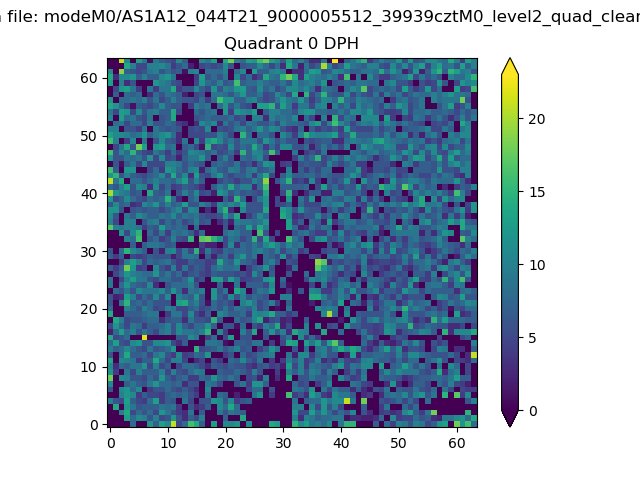 |
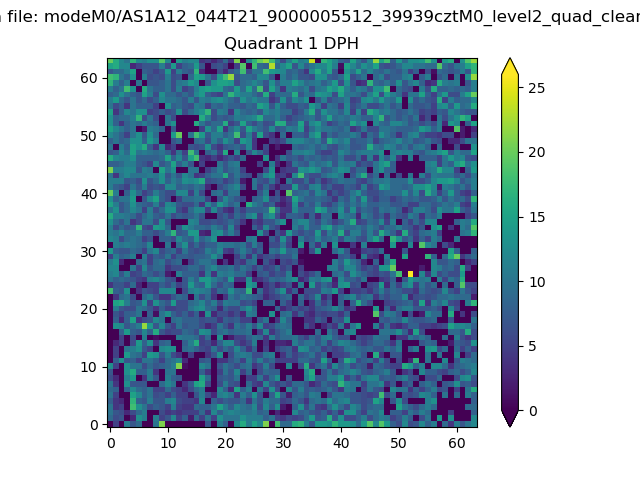 |
Quadrant B |
|---|---|---|---|
| Quadrant D | 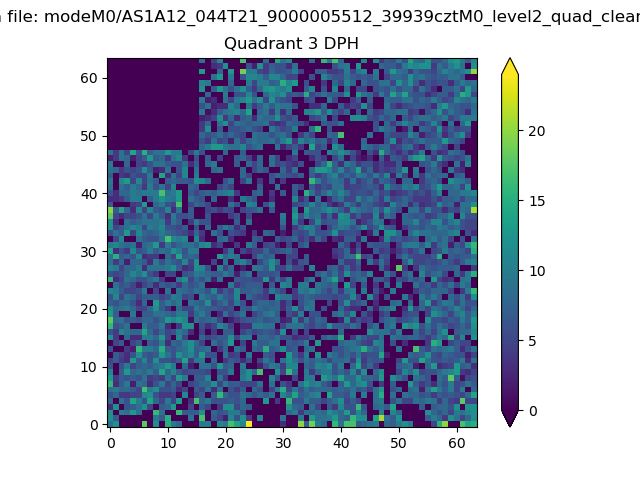 |
 |
Quadrant C |
| Plot type | Count rate plots | Images |
|---|---|---|
| Comparison with Poisson distribution Blue bars denote a histogram of data divided into 1 sec bins. Red curve is a Poisson curve with rate = median count rate of data. |
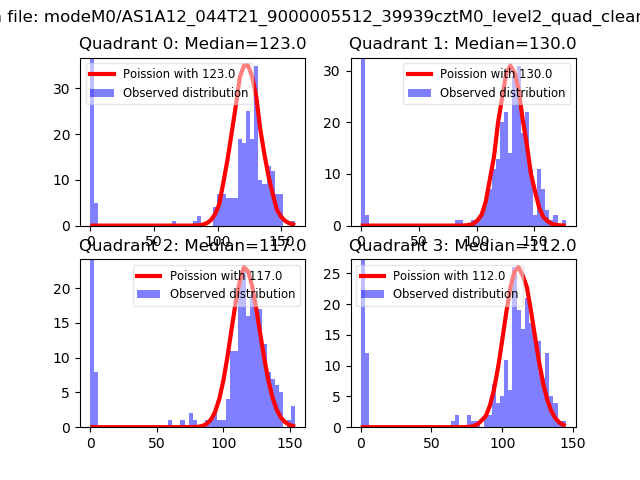 |
 |
| Quadrant-wise count rates Data is divided into 100 sec bins |
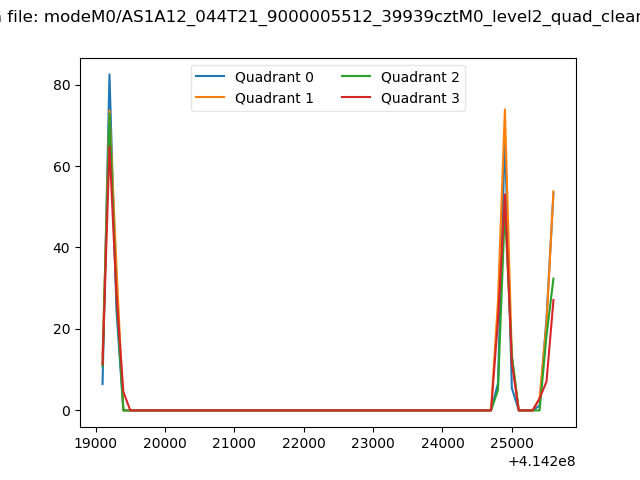 |
|
| Module-wise count rates for Quadrant A Data is divided into 100 sec bins |
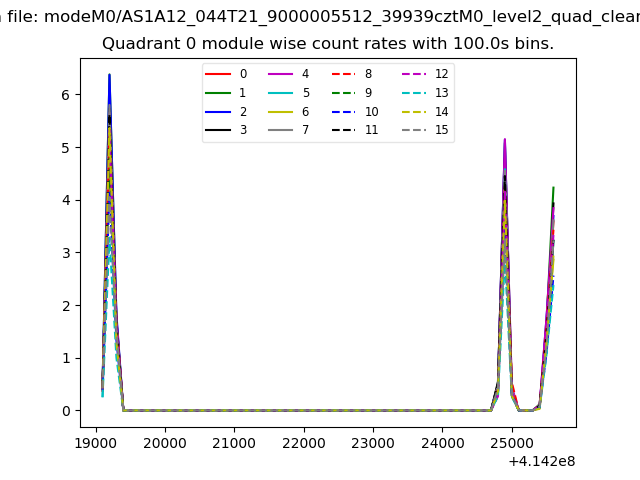 |
 |
| Module-wise count rates for Quadrant B Data is divided into 100 sec bins |
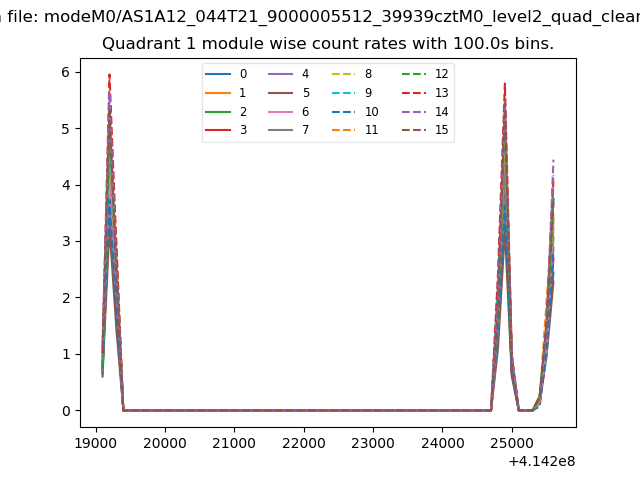 |
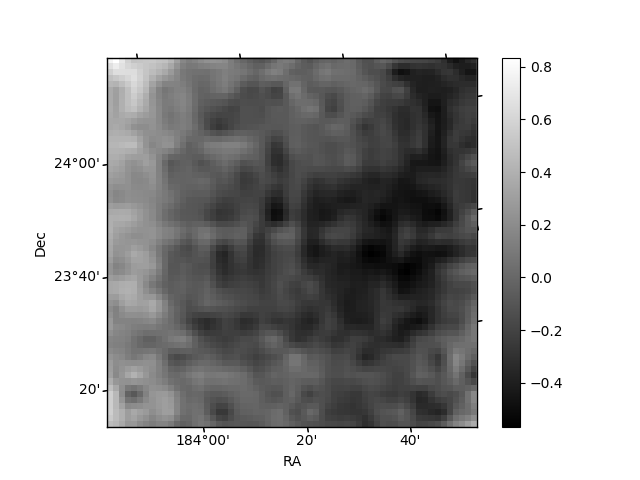 |
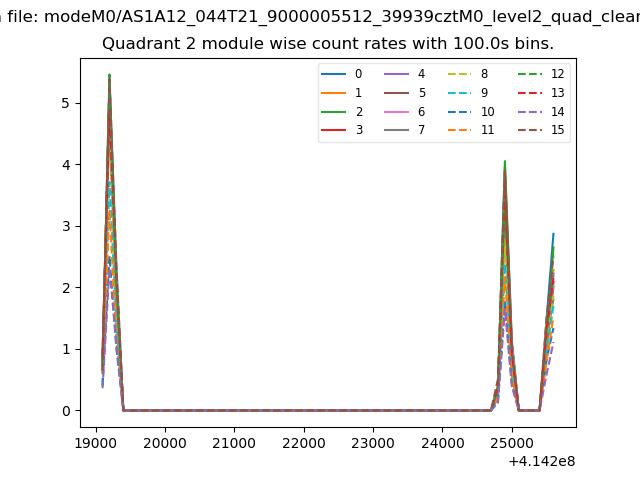
| Module-wise count rates for Quadrant C Data is divided into 100 sec bins |
 |
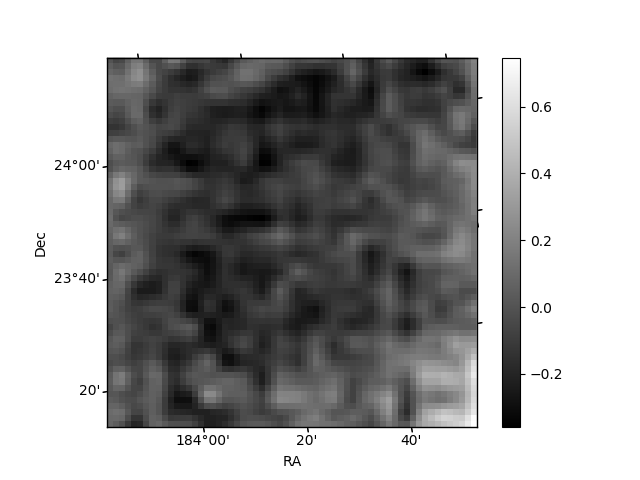 |
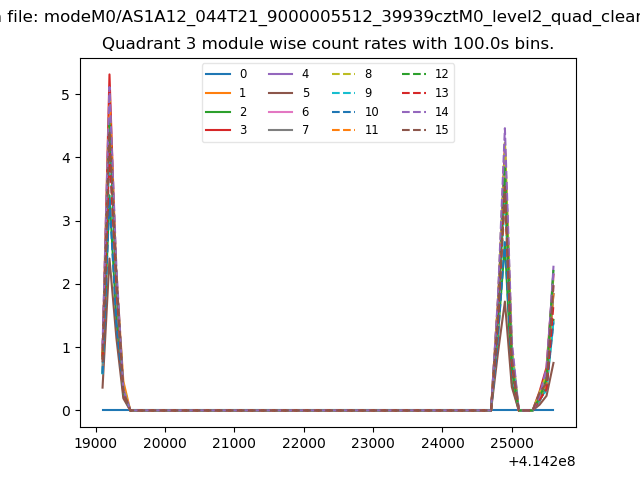
| Module-wise count rates for Quadrant D Data is divided into 100 sec bins |
 |
 |
| Parameter | Plot |
|---|---|
| CZT HV Monitor | 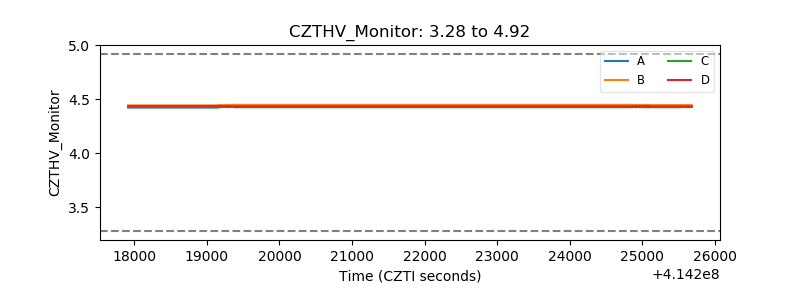 |
| D_VDD | 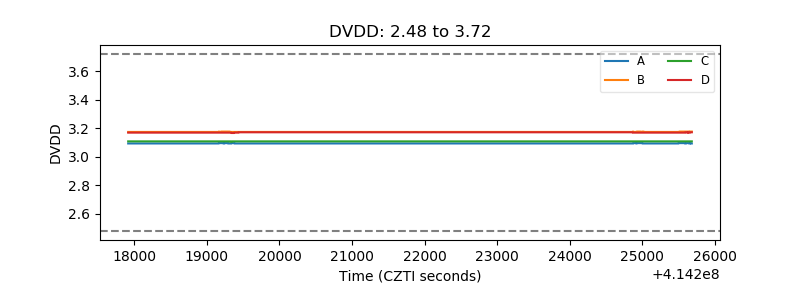 |
| Temperature 1 | 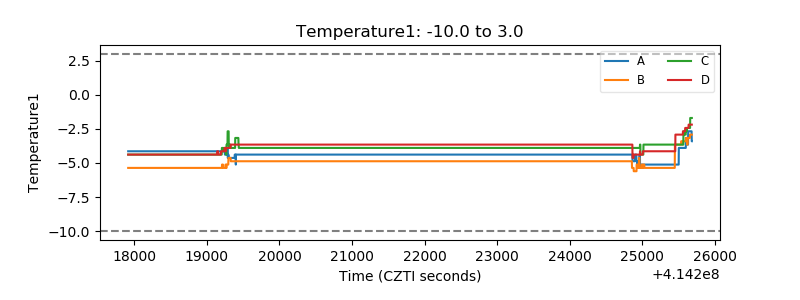 |
| Veto HV Monitor | 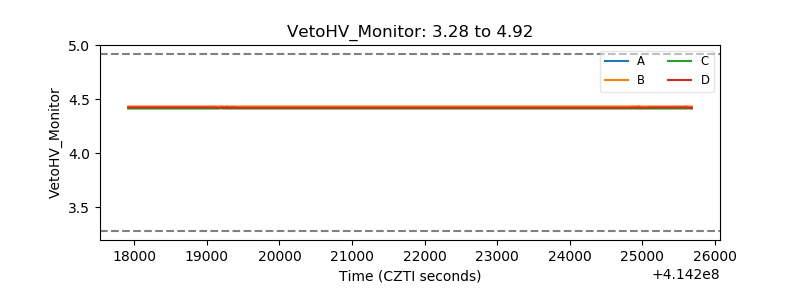 |
| Veto LLD | 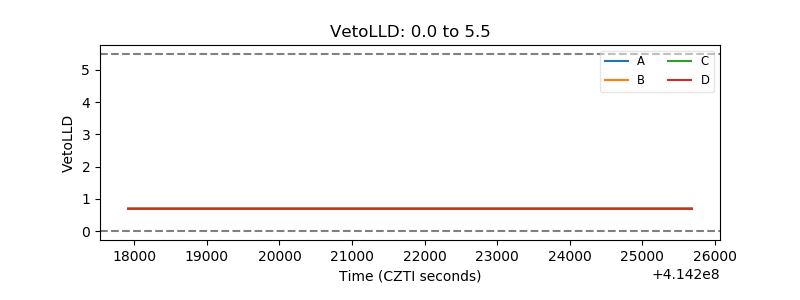 |
| Alpha Counter | 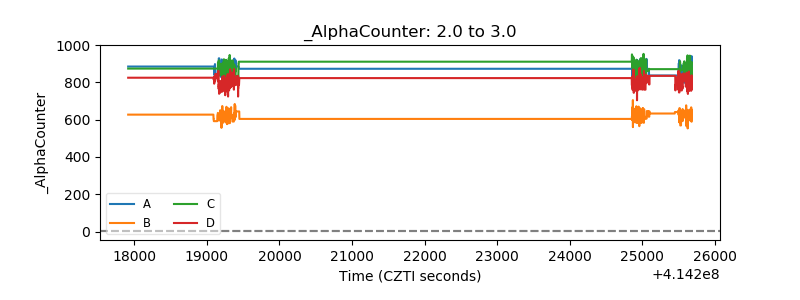 |
| _CPM_Rate | 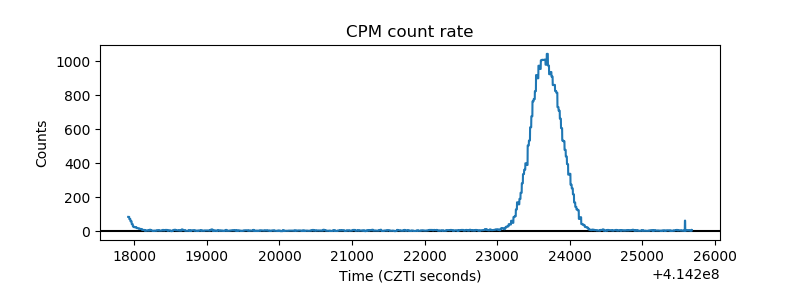 |
| CZT Counter | 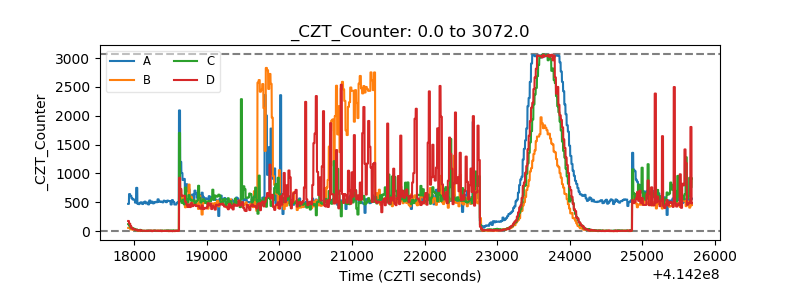 |
| +2.5 Volts monitor | 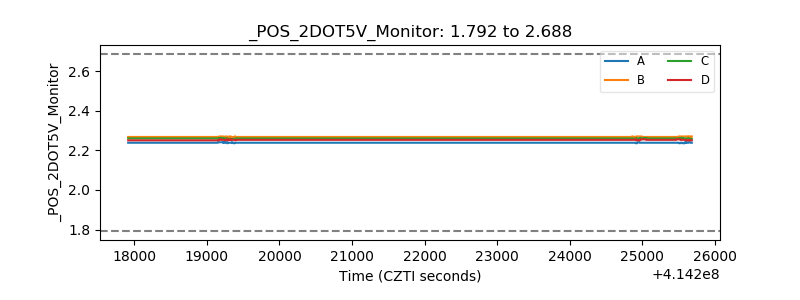 |
| +5 Volts monitor | 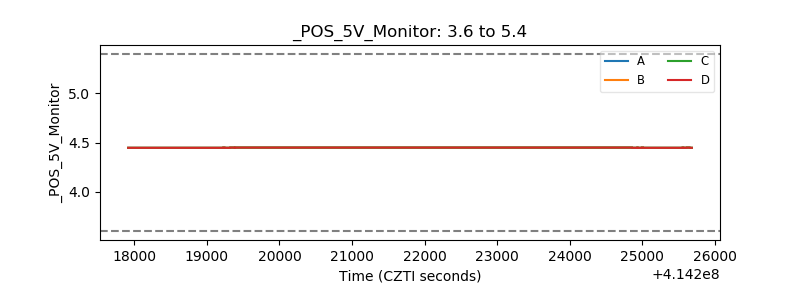 |
| _ROLL_ROT | 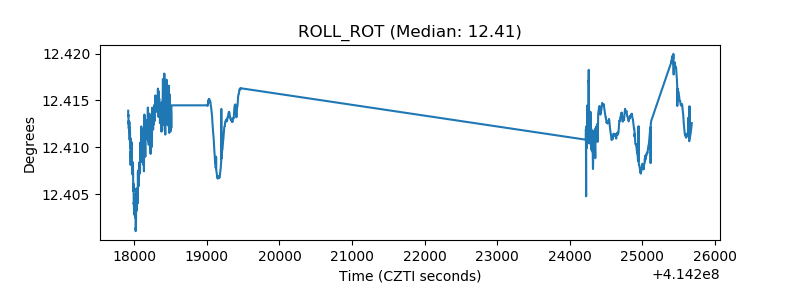 |
| _Roll_DEC | 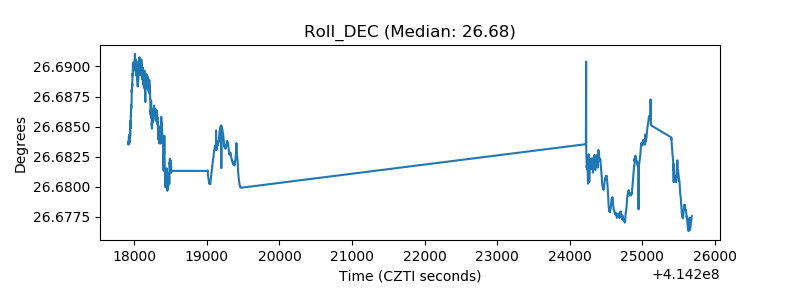 |
| _Roll_RA | 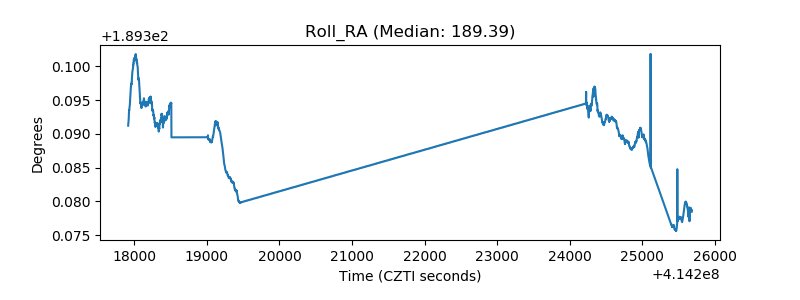 |
| Veto Counter | 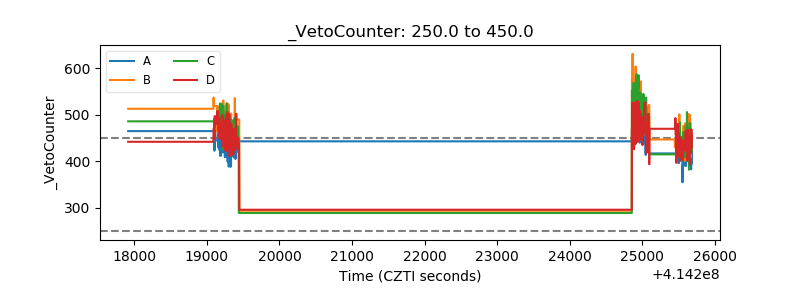 |