| Param | Original file | Final file |
|---|---|---|
| Filename | modeM0/AS1A12_097T02_9000005542_40516cztM0_level2.fits | modeM0/AS1A12_097T02_9000005542_40516cztM0_level2_quad_clean.evt |
| Size (bytes) | 308,975,040 | 89,573,760 |
| Size | 294.7 MB | 85.4 MB |
| Events in quadrant A | 2,957,369 | 603,478 |
| Events in quadrant B | 2,556,716 | 629,046 |
| Events in quadrant C | 2,890,487 | 592,943 |
| Events in quadrant D | 2,608,612 | 506,528 |
| Mode M0 | |||
|---|---|---|---|
| Quadrant | BADHDUFLAG | Total packets | Discarded packets |
| A | 0 | 11987 | 2 |
| B | 0 | 11107 | 2 |
| C | 0 | 11933 | 2 |
| D | 0 | 11454 | 2 |
| Mode SS | |||
|---|---|---|---|
| Quadrant | BADHDUFLAG | Total packets | Discarded packets |
| A | 0 | 110 | 0 |
| B | 0 | 110 | 0 |
| C | 0 | 110 | 0 |
| D | 0 | 110 | 0 |
| Mode M9 | |||
|---|---|---|---|
| Quadrant | BADHDUFLAG | Total packets | Discarded packets |
| A | 0 | 18 | 0 |
| B | 0 | 18 | 0 |
| C | 0 | 18 | 0 |
| D | 0 | 19 | 0 |
| Quadrant | Total seconds | Saturated seconds | Saturation percentage |
|---|---|---|---|
| A | 5432 | 12 | 0.220913% |
| B | 5432 | 8 | 0.147275% |
| C | 5432 | 56 | 1.030928% |
| D | 5432 | 470 | 8.652430% |
Noise dominated data is calculated using 1-second bins in cleaned event files. If a bin has >2000 counts, and if more than 50% of those come from <1% of pixels, then it is considered to be noise-dominated and hence unusable.
| Quadrant | # 1 sec bins | Bins with >0 counts | Bins with >2000 counts | High rate bins dominated by noise | Noise dominated (total time) | Noise dominated (detector-on time) | Marked lightcurve |
|---|---|---|---|---|---|---|---|
| A | 7164 | 5433 | 3 | 3 | 0.04% | 0.06% | 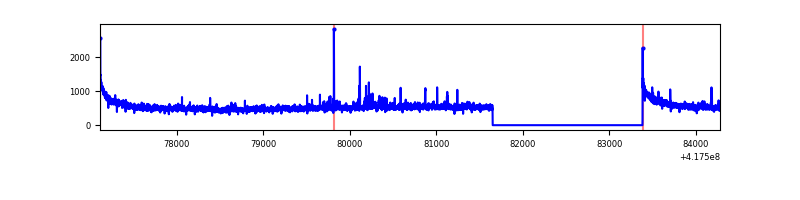 |
| B | 7164 | 5433 | 2 | 2 | 0.03% | 0.04% | 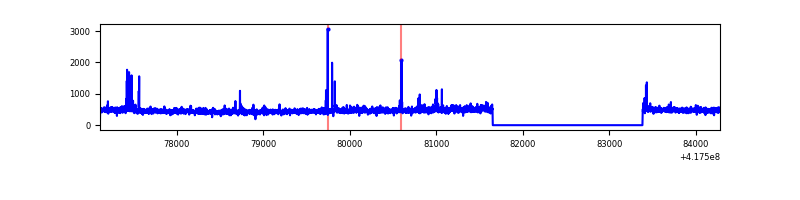 |
| C | 7164 | 5433 | 47 | 47 | 0.66% | 0.87% | 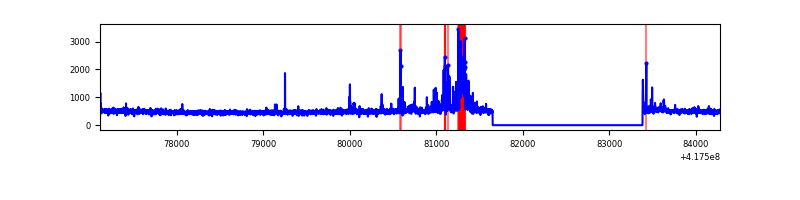 |
| D | 7164 | 5433 | 19 | 19 | 0.27% | 0.35% | 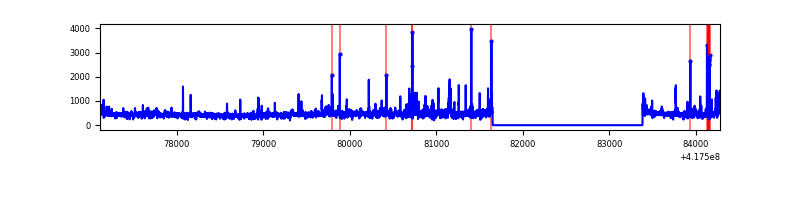 |
Top three noisy pixels from each quadrant. If the there are fewer than three noisy pixels in the level2.evt file, extra rows are filled as -1
| Pixel properties | Quadrant properties | ||||||
|---|---|---|---|---|---|---|---|
| Quadrant | DetID | PixID | Counts | Sigma | Mean | Median | Sigma |
| A | 10 | 83 | 502500 | 3997.02 | 609 | 598 | 125.6 |
| A | 12 | 189 | 51398 | 404.56 | 609 | 598 | 125.6 |
| A | 2 | 79 | 25982 | 202.15 | 609 | 598 | 125.6 |
| B | 3 | 112 | 60963 | 505.26 | 609 | 593 | 119.5 |
| B | 4 | 170 | 30670 | 251.73 | 609 | 593 | 119.5 |
| B | 0 | 230 | 28681 | 235.08 | 609 | 593 | 119.5 |
| C | 10 | 20 | 269909 | 1926.53 | 594 | 598 | 139.8 |
| C | 15 | 214 | 242091 | 1727.53 | 594 | 598 | 139.8 |
| C | 14 | 254 | 42693 | 301.13 | 594 | 598 | 139.8 |
| D | 12 | 191 | 161431 | 1129.31 | 565 | 548 | 142.5 |
| D | 12 | 227 | 101184 | 706.41 | 565 | 548 | 142.5 |
| D | 12 | 128 | 46897 | 325.34 | 565 | 548 | 142.5 |
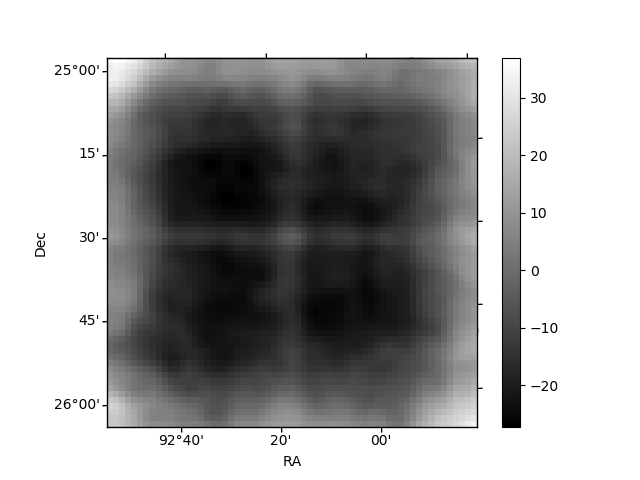
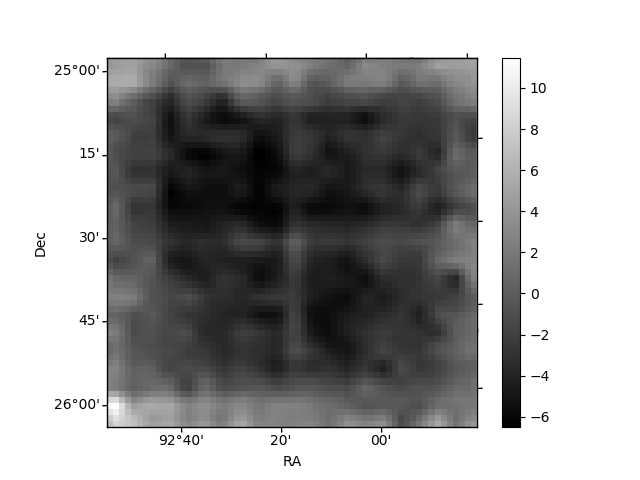
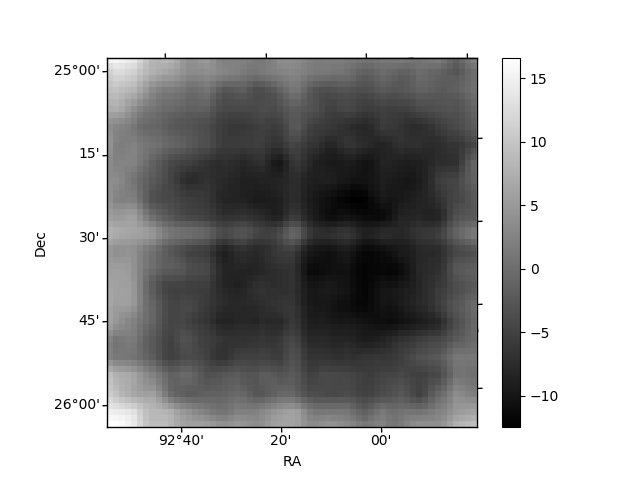
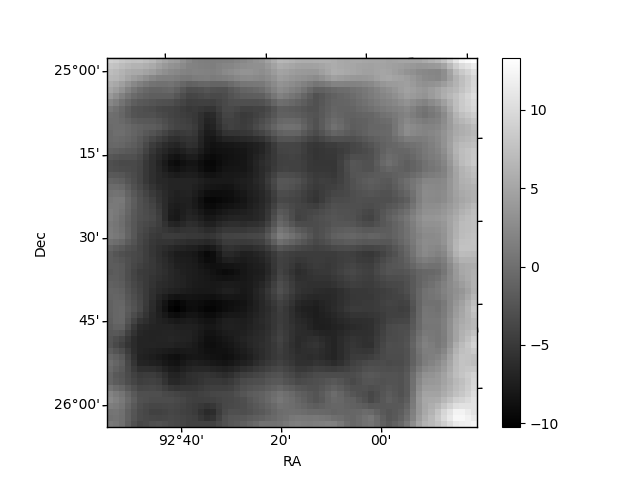
Histogram calculated using DETX and DETY for each event in the final _common_clean file
| Quadrant A | 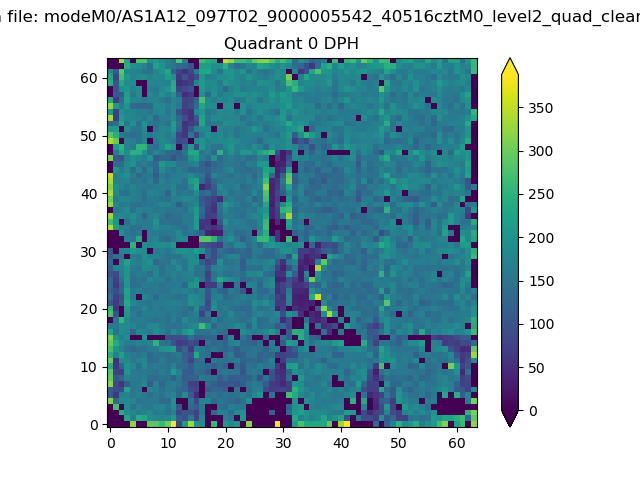 |
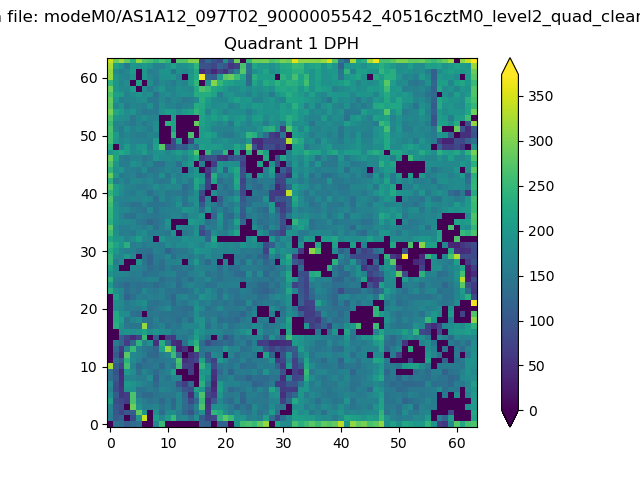 |
Quadrant B |
|---|---|---|---|
| Quadrant D | 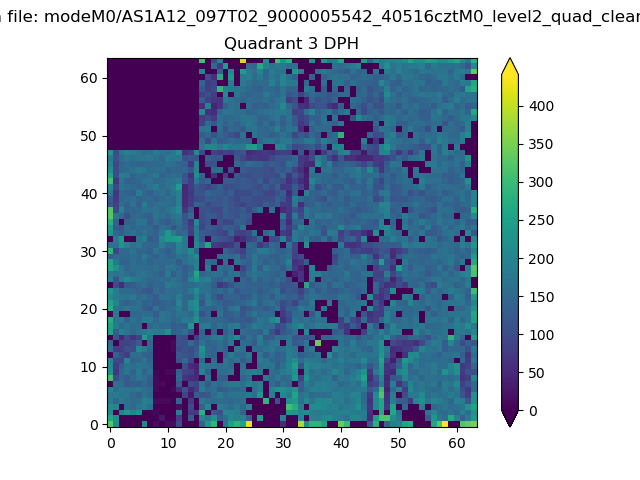 |
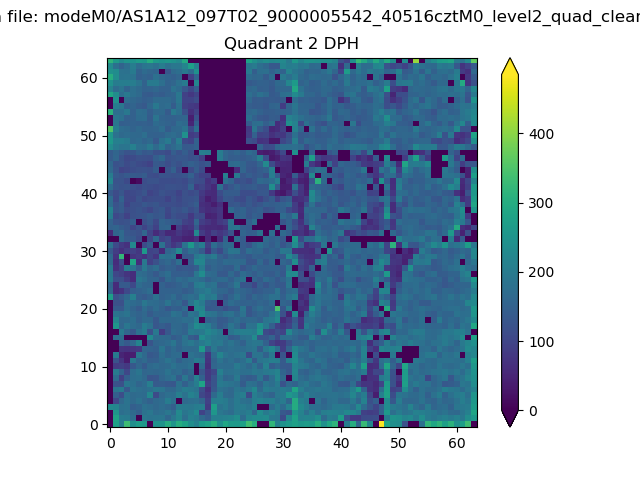 |
Quadrant C |
| Plot type | Count rate plots | Images |
|---|---|---|
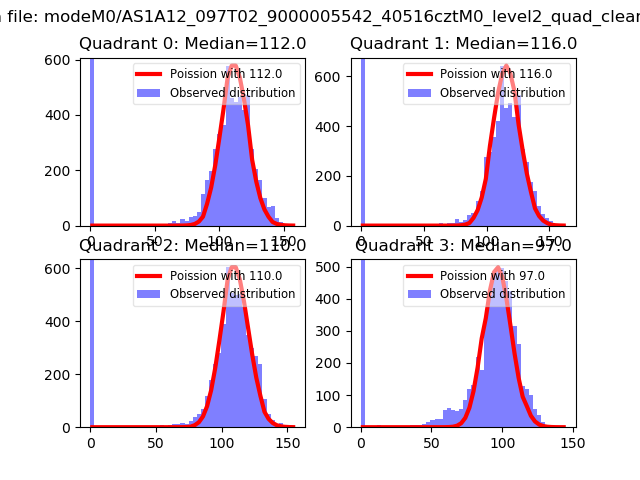
| Comparison with Poisson distribution Blue bars denote a histogram of data divided into 1 sec bins. Red curve is a Poisson curve with rate = median count rate of data. |
 |
 |
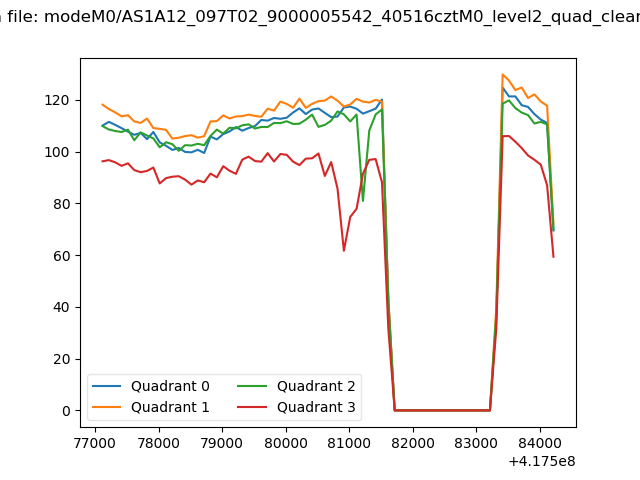
| Quadrant-wise count rates Data is divided into 100 sec bins |
 |
|
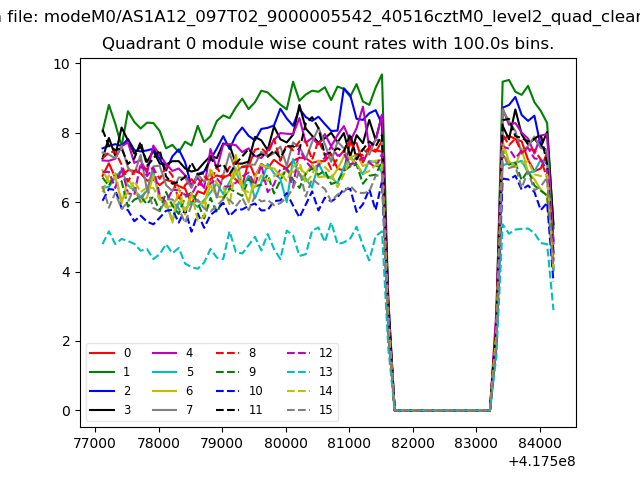
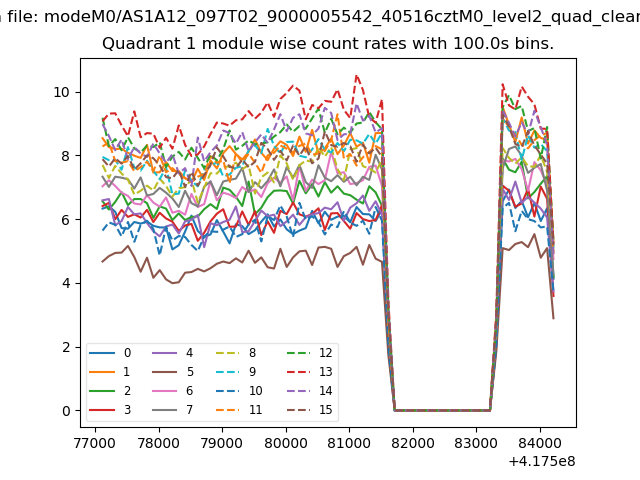
| Module-wise count rates for Quadrant A Data is divided into 100 sec bins |
 |
 |
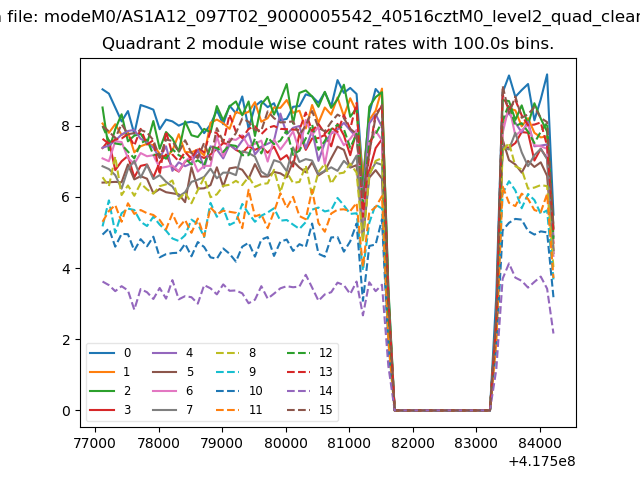
| Module-wise count rates for Quadrant B Data is divided into 100 sec bins |
 |
 |
| Module-wise count rates for Quadrant C Data is divided into 100 sec bins |
 |
 |
| Module-wise count rates for Quadrant D Data is divided into 100 sec bins |
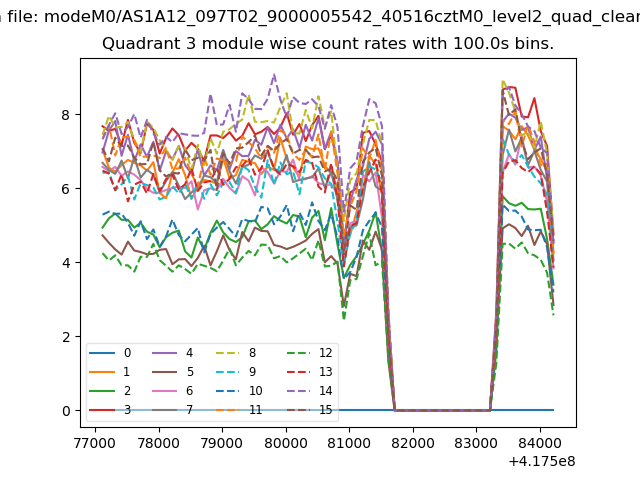 |
 |
| Parameter | Plot |
|---|---|
| CZT HV Monitor | 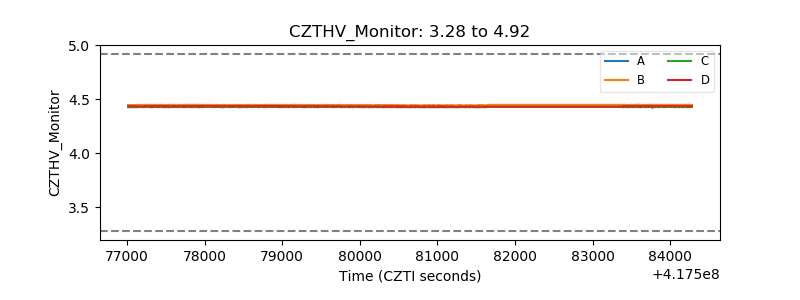 |
| D_VDD | 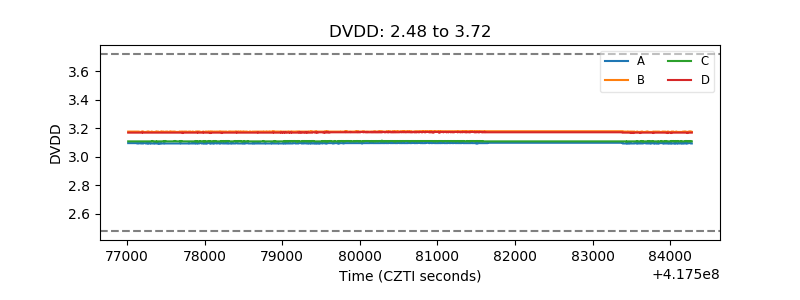 |
| Temperature 1 | 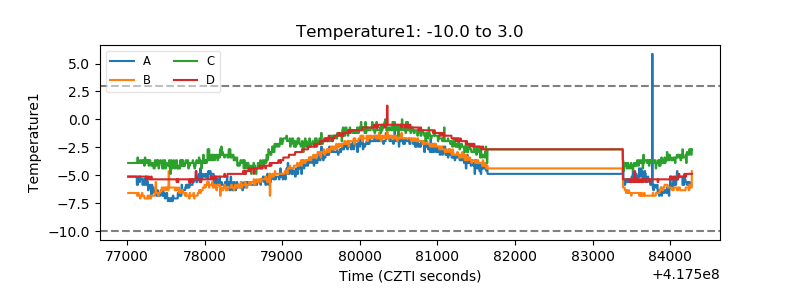 |
| Veto HV Monitor | 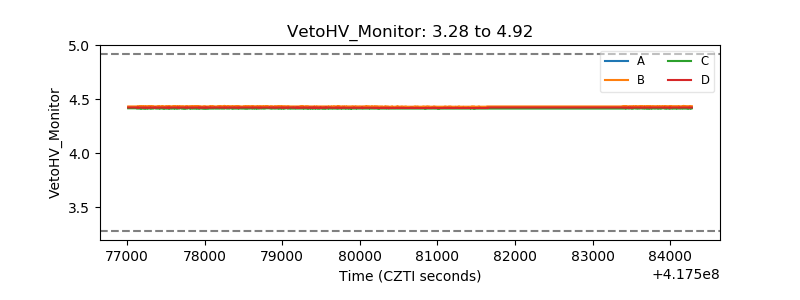 |
| Veto LLD | 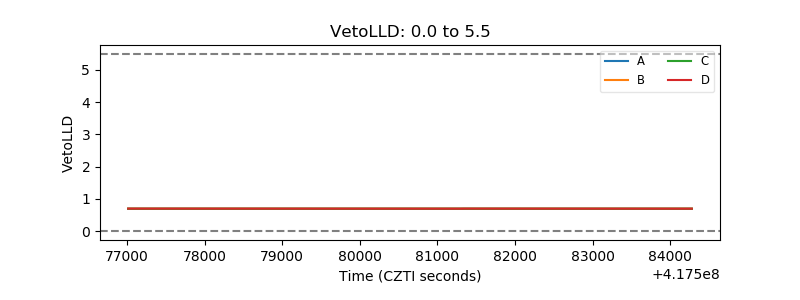 |
| Alpha Counter | 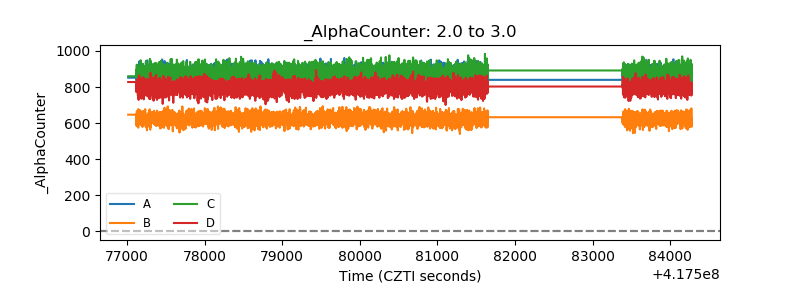 |
| _CPM_Rate | 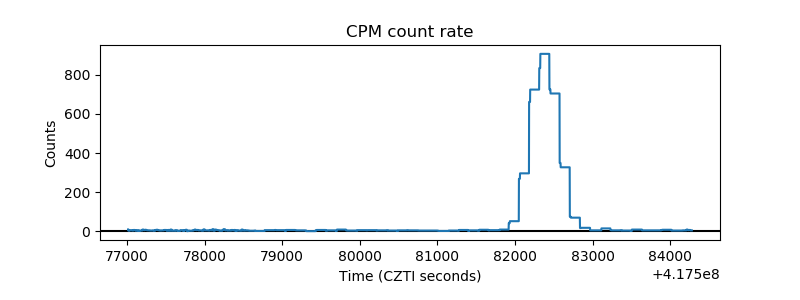 |
| CZT Counter | 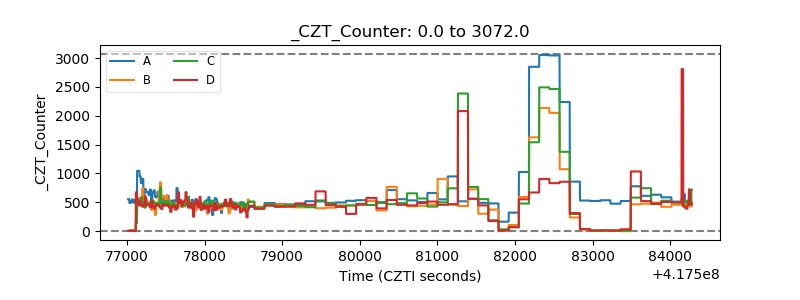 |
| +2.5 Volts monitor | 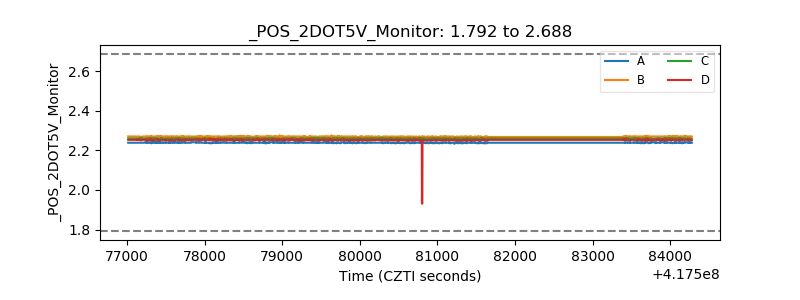 |
| +5 Volts monitor | 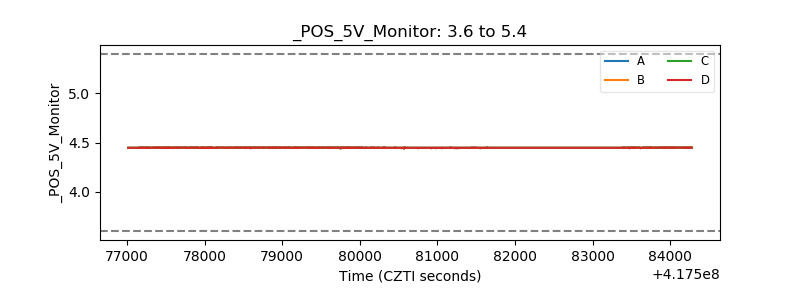 |
| _ROLL_ROT |  |
| _Roll_DEC | 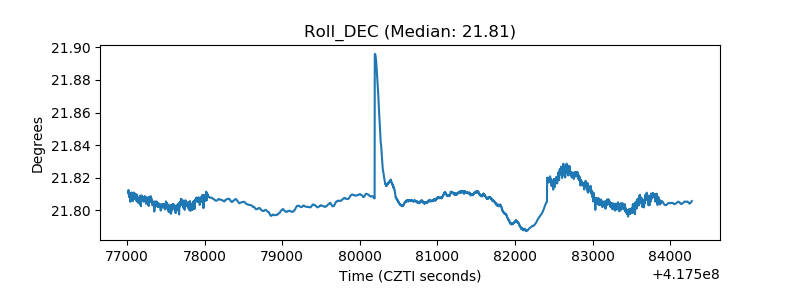 |
| _Roll_RA | 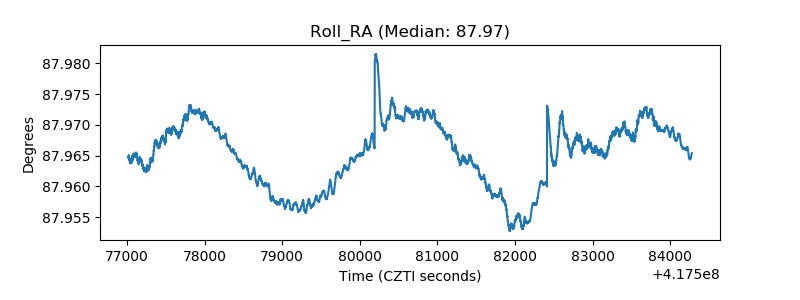 |
| Veto Counter | 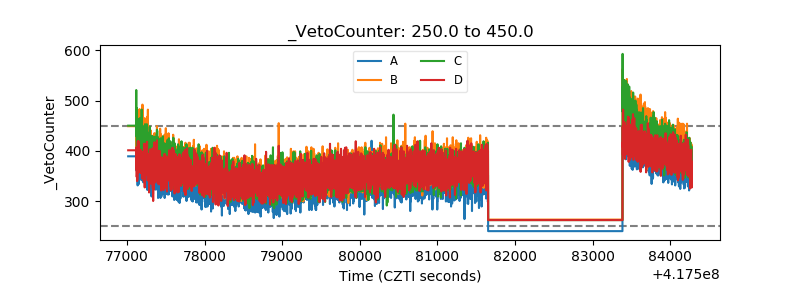 |