| Param | Original file | Final file |
|---|---|---|
| Filename | modeM0/AS1A12_029T01_9000005556_40635cztM0_level2.fits | modeM0/AS1A12_029T01_9000005556_40635cztM0_level2_quad_clean.evt |
| Size (bytes) | 306,676,800 | 87,387,840 |
| Size | 292.5 MB | 83.3 MB |
| Events in quadrant A | 2,766,332 | 602,317 |
| Events in quadrant B | 2,613,599 | 621,524 |
| Events in quadrant C | 2,491,635 | 579,920 |
| Events in quadrant D | 3,085,433 | 487,854 |
| Mode M0 | |||
|---|---|---|---|
| Quadrant | BADHDUFLAG | Total packets | Discarded packets |
| A | 0 | 11069 | 3 |
| B | 0 | 10901 | 2 |
| C | 0 | 10365 | 2 |
| D | 0 | 12511 | 2 |
| Mode M9 | |||
|---|---|---|---|
| Quadrant | BADHDUFLAG | Total packets | Discarded packets |
| A | 0 | 33 | 0 |
| B | 0 | 33 | 0 |
| C | 0 | 33 | 0 |
| D | 0 | 34 | 0 |
| Mode SS | |||
|---|---|---|---|
| Quadrant | BADHDUFLAG | Total packets | Discarded packets |
| A | 0 | 102 | 0 |
| B | 0 | 102 | 0 |
| C | 0 | 102 | 0 |
| D | 0 | 102 | 0 |
| Quadrant | Total seconds | Saturated seconds | Saturation percentage |
|---|---|---|---|
| A | 5062 | 10 | 0.197550% |
| B | 5062 | 37 | 0.730936% |
| C | 5062 | 8 | 0.158040% |
| D | 5062 | 508 | 10.035559% |
Noise dominated data is calculated using 1-second bins in cleaned event files. If a bin has >2000 counts, and if more than 50% of those come from <1% of pixels, then it is considered to be noise-dominated and hence unusable.
| Quadrant | # 1 sec bins | Bins with >0 counts | Bins with >2000 counts | High rate bins dominated by noise | Noise dominated (total time) | Noise dominated (detector-on time) | Marked lightcurve |
|---|---|---|---|---|---|---|---|
| A | 7186 | 5063 | 4 | 4 | 0.06% | 0.08% | 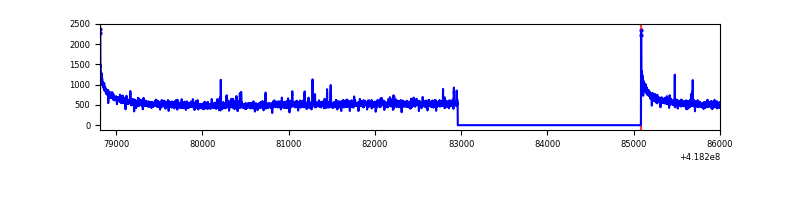 |
| B | 7186 | 5063 | 17 | 17 | 0.24% | 0.34% | 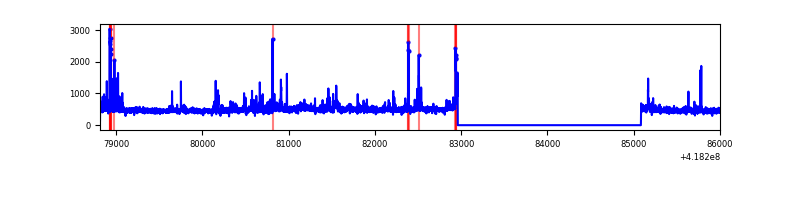 |
| C | 7186 | 5063 | 6 | 6 | 0.08% | 0.12% | 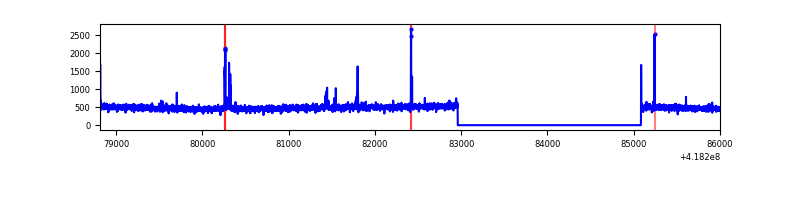 |
| D | 7186 | 5062 | 227 | 227 | 3.16% | 4.48% | 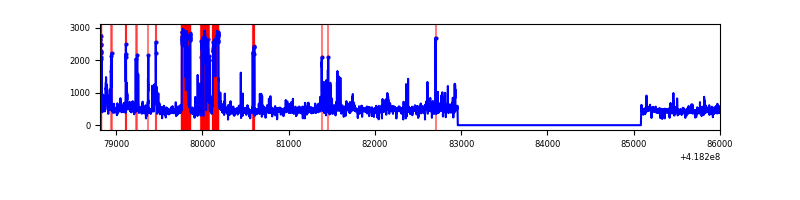 |
Top three noisy pixels from each quadrant. If the there are fewer than three noisy pixels in the level2.evt file, extra rows are filled as -1
| Pixel properties | Quadrant properties | ||||||
|---|---|---|---|---|---|---|---|
| Quadrant | DetID | PixID | Counts | Sigma | Mean | Median | Sigma |
| A | 10 | 83 | 460151 | 3843.02 | 588 | 578 | 119.6 |
| A | 2 | 79 | 29361 | 240.69 | 588 | 578 | 119.6 |
| A | 1 | 113 | 7080 | 54.37 | 588 | 578 | 119.6 |
| B | 0 | 190 | 115832 | 1023.63 | 582 | 567 | 112.6 |
| B | 5 | 255 | 93188 | 822.54 | 582 | 567 | 112.6 |
| B | 0 | 229 | 74470 | 656.31 | 582 | 567 | 112.6 |
| C | 15 | 214 | 223343 | 1699.22 | 563 | 567 | 131.1 |
| C | 14 | 254 | 36480 | 273.93 | 563 | 567 | 131.1 |
| C | 15 | 159 | 21137 | 156.9 | 563 | 567 | 131.1 |
| D | 13 | 249 | 669977 | 5123.67 | 532 | 519 | 130.7 |
| D | 12 | 191 | 144151 | 1099.28 | 532 | 519 | 130.7 |
| D | 2 | 250 | 83390 | 634.25 | 532 | 519 | 130.7 |
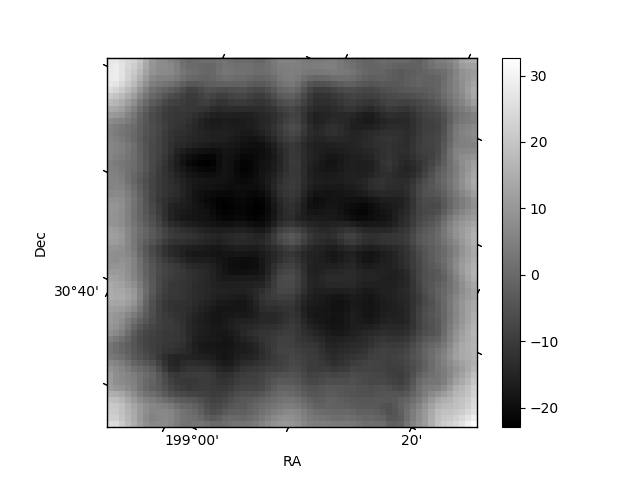
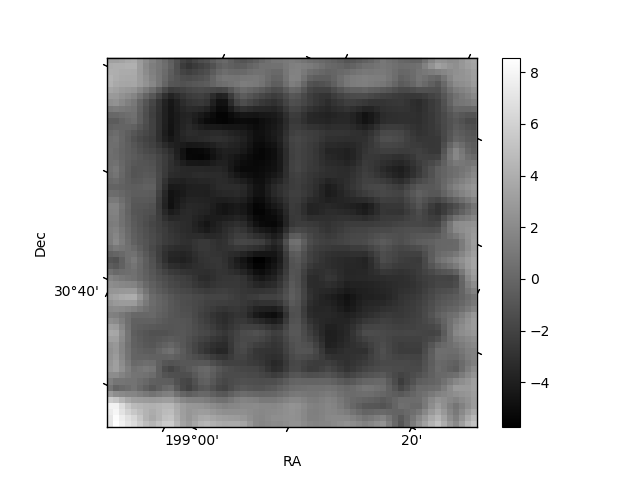
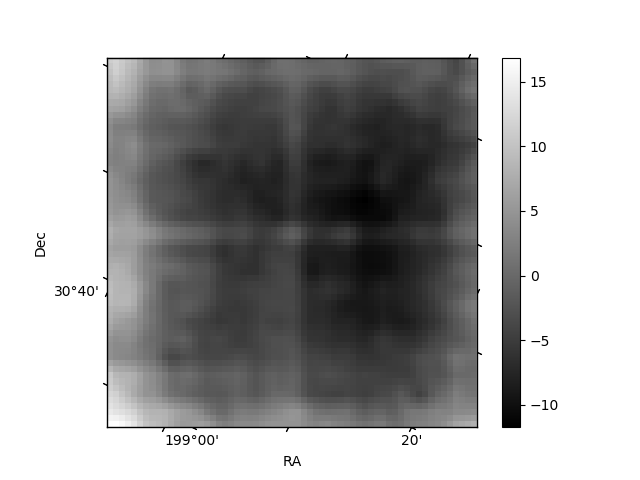
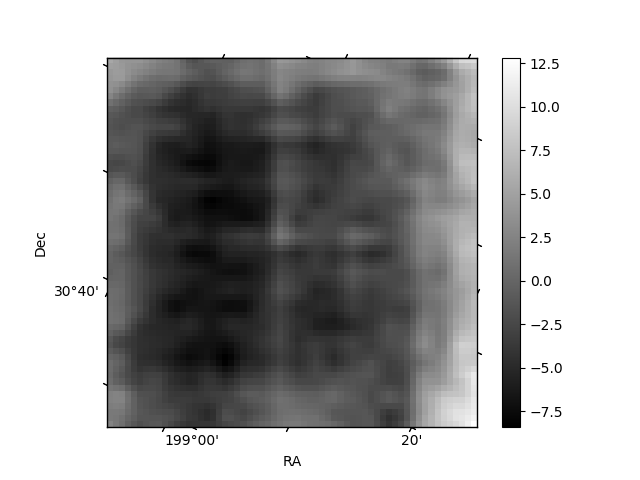
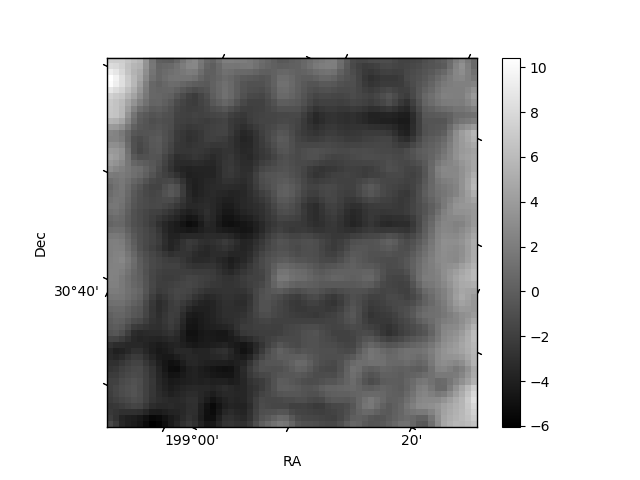
Histogram calculated using DETX and DETY for each event in the final _common_clean file
| Quadrant A | 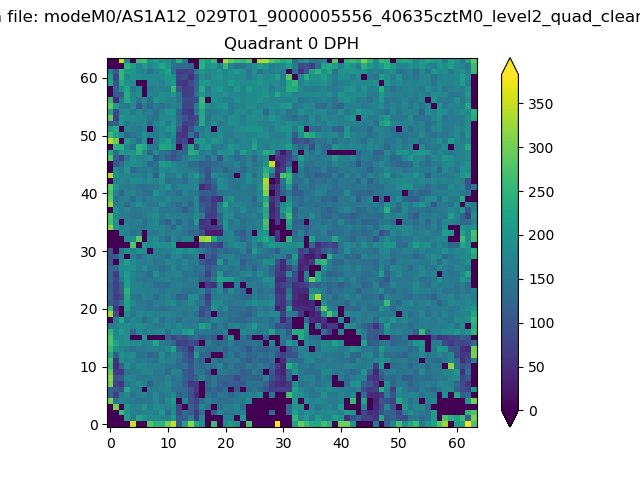 |
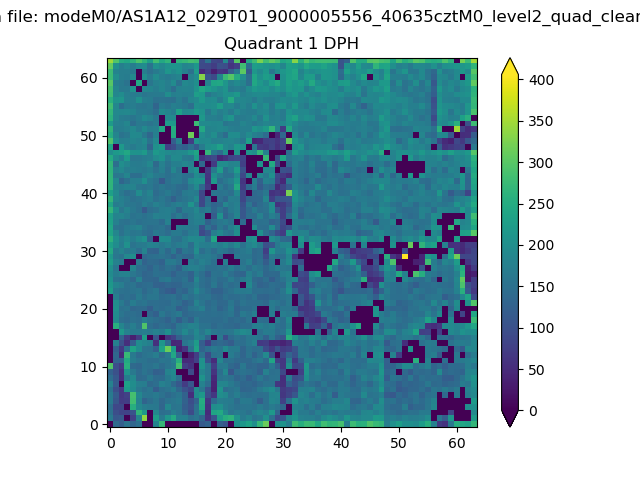 |
Quadrant B |
|---|---|---|---|
| Quadrant D | 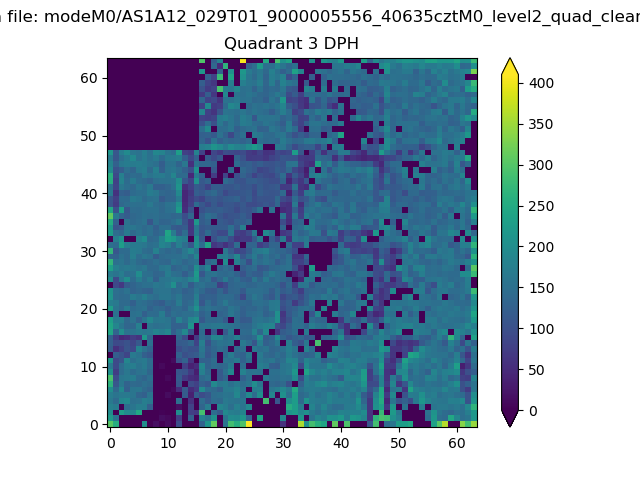 |
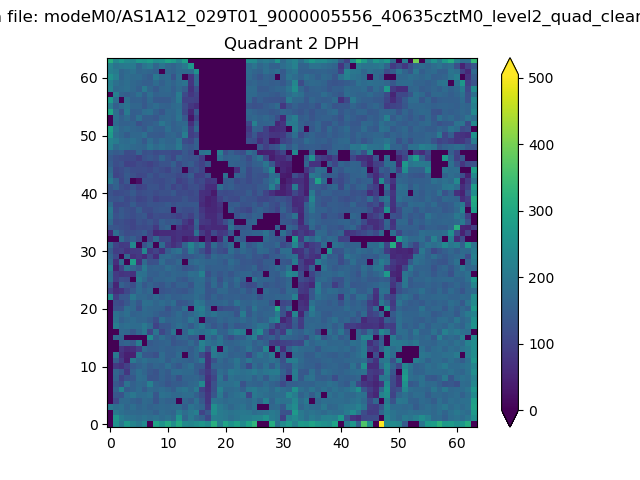 |
Quadrant C |
| Plot type | Count rate plots | Images |
|---|---|---|
| Comparison with Poisson distribution Blue bars denote a histogram of data divided into 1 sec bins. Red curve is a Poisson curve with rate = median count rate of data. |
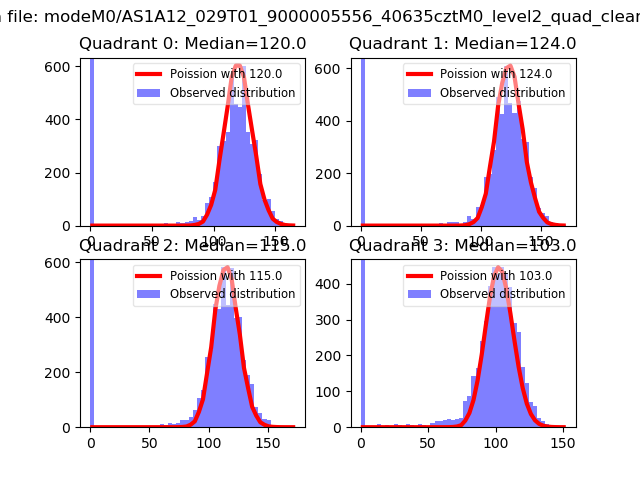 |
 |
| Quadrant-wise count rates Data is divided into 100 sec bins |
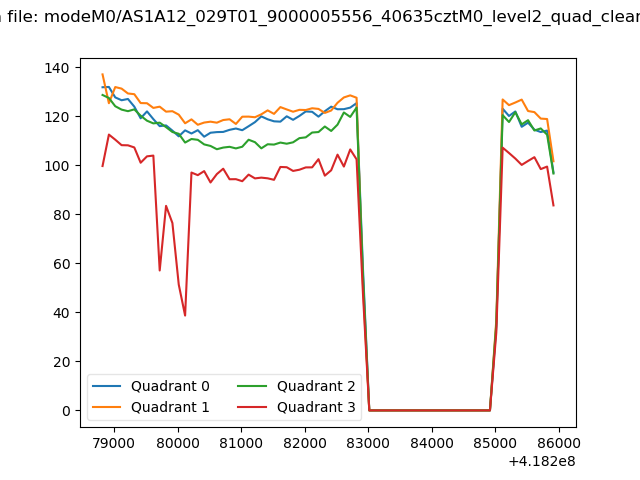 |
|
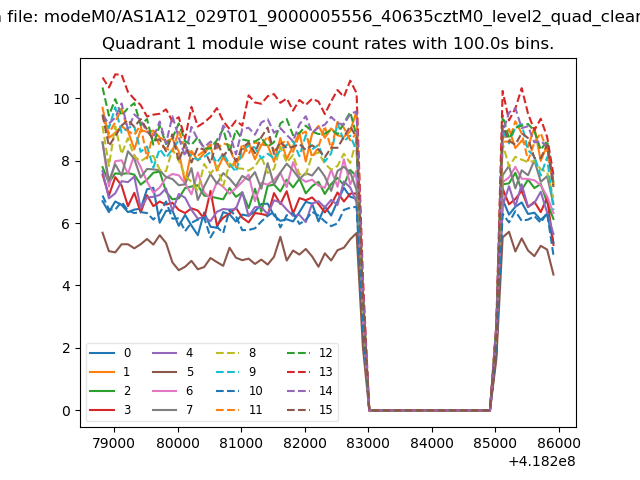
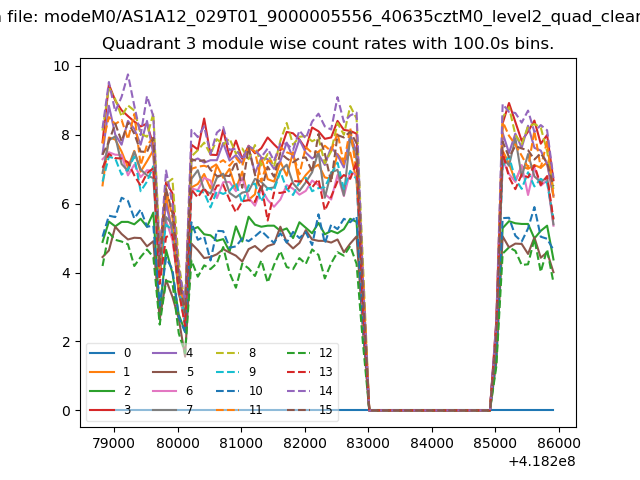
| Module-wise count rates for Quadrant A Data is divided into 100 sec bins |
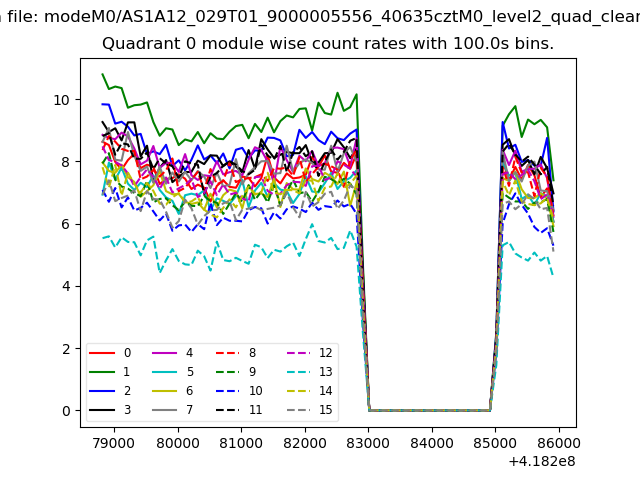 |
 |
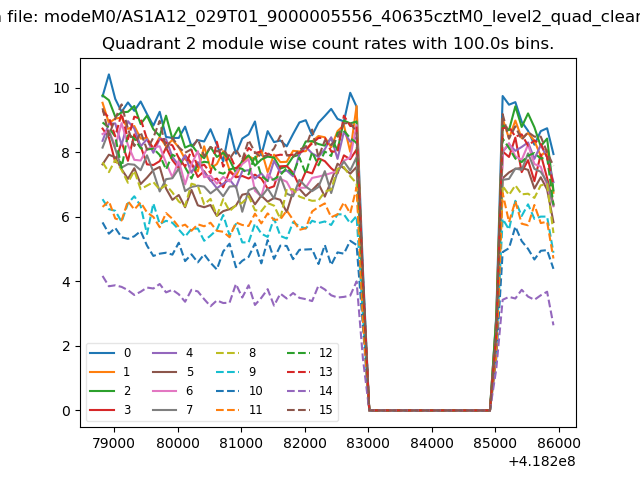
| Module-wise count rates for Quadrant B Data is divided into 100 sec bins |
 |
 |
| Module-wise count rates for Quadrant C Data is divided into 100 sec bins |
 |
 |
| Module-wise count rates for Quadrant D Data is divided into 100 sec bins |
 |
 |
| Parameter | Plot |
|---|---|
| CZT HV Monitor | 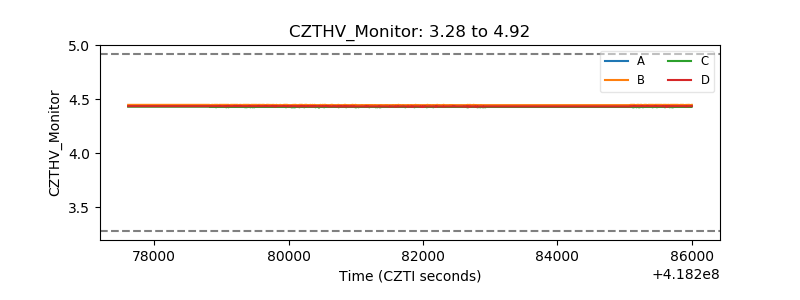 |
| D_VDD | 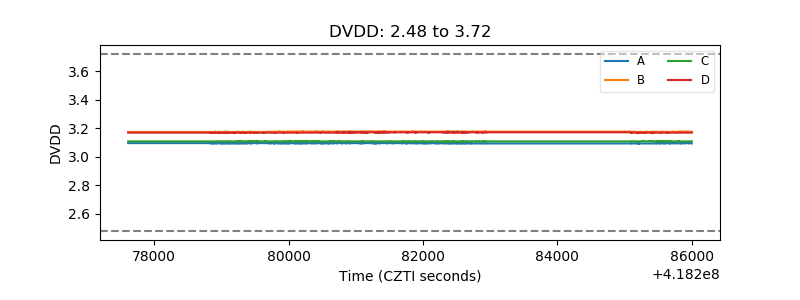 |
| Temperature 1 | 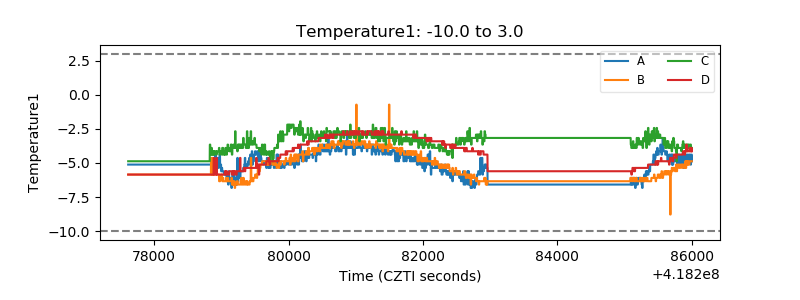 |
| Veto HV Monitor | 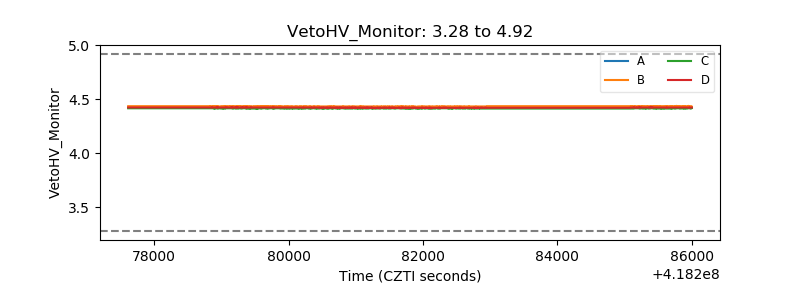 |
| Veto LLD | 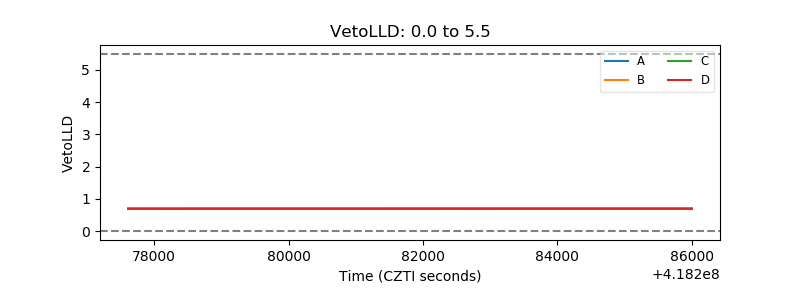 |
| Alpha Counter | 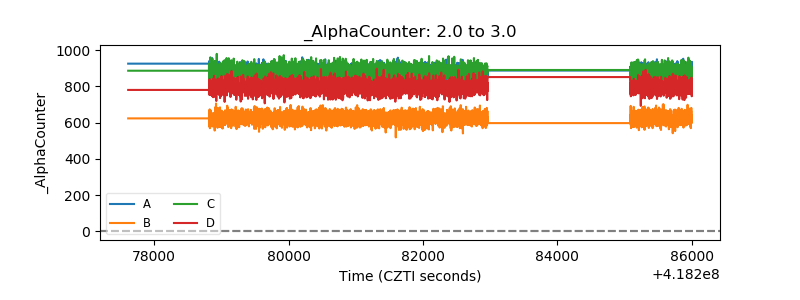 |
| _CPM_Rate | 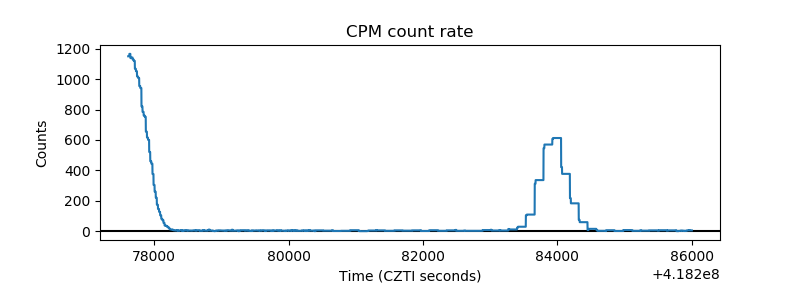 |
| CZT Counter | 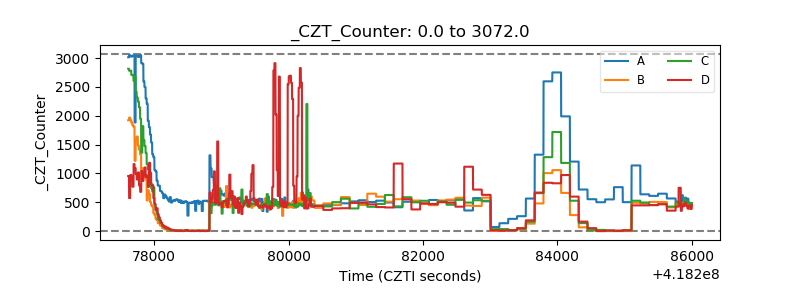 |
| +2.5 Volts monitor | 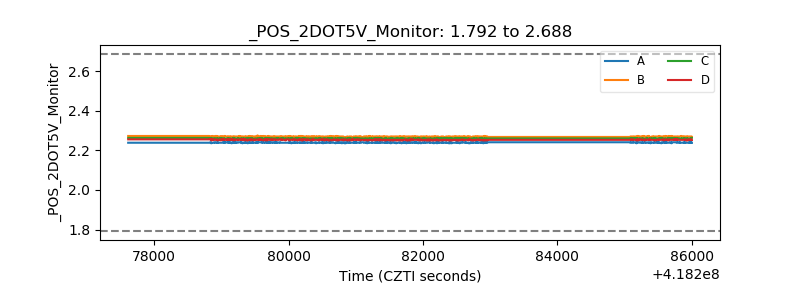 |
| +5 Volts monitor | 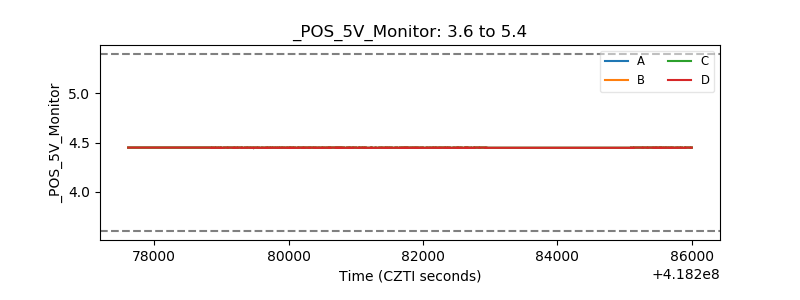 |
| _ROLL_ROT | 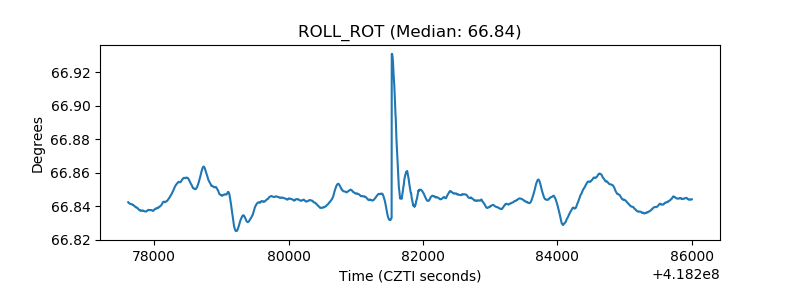 |
| _Roll_DEC | 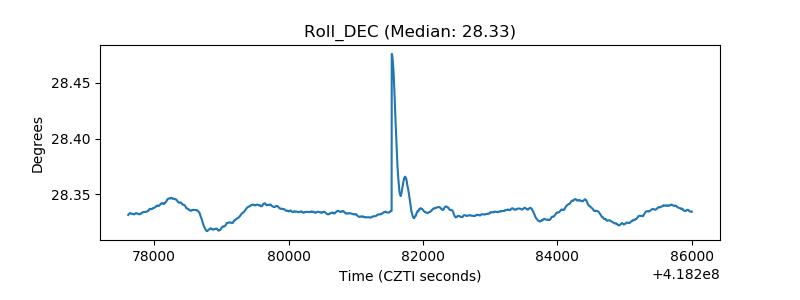 |
| _Roll_RA | 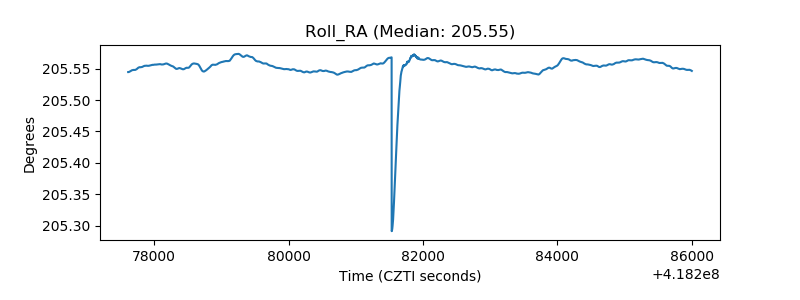 |
| Veto Counter | 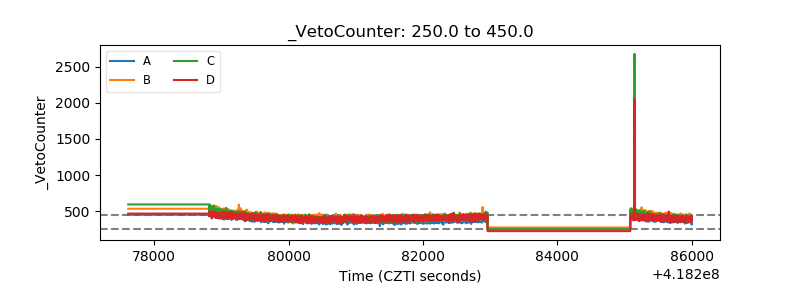 |