| Param | Original file | Final file |
|---|---|---|
| Filename | modeM0/AS1A13_012T01_9000005942_44083cztM0_level2.fits | modeM0/AS1A13_012T01_9000005942_44083cztM0_level2_quad_clean.evt |
| Size (bytes) | 19,779,840 | 6,122,880 |
| Size | 18.9 MB | 5.8 MB |
| Events in quadrant A | 202,672 | 40,062 |
| Events in quadrant B | 147,174 | 41,095 |
| Events in quadrant C | 145,051 | 37,527 |
| Events in quadrant D | 206,347 | 34,333 |
| Mode M0 | |||
|---|---|---|---|
| Quadrant | BADHDUFLAG | Total packets | Discarded packets |
| A | 0 | 809 | 0 |
| B | 0 | 701 | 0 |
| C | 0 | 698 | 1 |
| D | 0 | 855 | 0 |
| Mode SS | |||
|---|---|---|---|
| Quadrant | BADHDUFLAG | Total packets | Discarded packets |
| A | 0 | 8 | 0 |
| B | 0 | 8 | 0 |
| C | 0 | 8 | 0 |
| D | 0 | 8 | 0 |
| Quadrant | Total seconds | Saturated seconds | Saturation percentage |
|---|---|---|---|
| A | 350 | 0 | 0.000000% |
| B | 350 | 0 | 0.000000% |
| C | 349 | 0 | 0.000000% |
| D | 349 | 10 | 2.865330% |
Noise dominated data is calculated using 1-second bins in cleaned event files. If a bin has >2000 counts, and if more than 50% of those come from <1% of pixels, then it is considered to be noise-dominated and hence unusable.
| Quadrant | # 1 sec bins | Bins with >0 counts | Bins with >2000 counts | High rate bins dominated by noise | Noise dominated (total time) | Noise dominated (detector-on time) | Marked lightcurve |
|---|---|---|---|---|---|---|---|
| A | 350 | 350 | 0 | 0 | 0.00% | 0.00% | 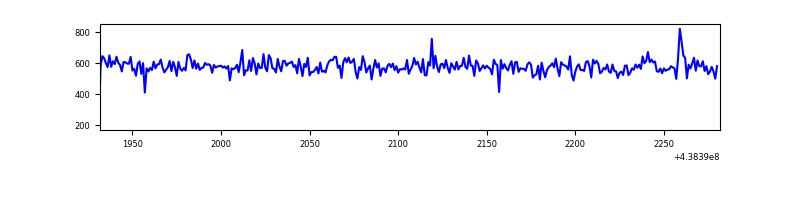 |
| B | 350 | 350 | 0 | 0 | 0.00% | 0.00% | 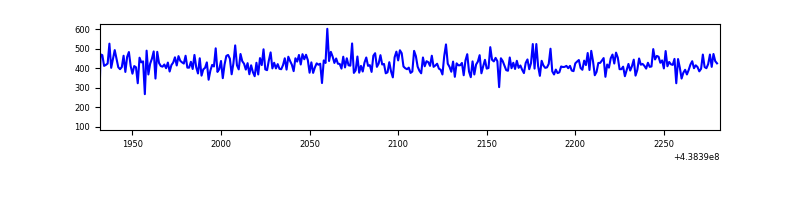 |
| C | 349 | 349 | 0 | 0 | 0.00% | 0.00% | 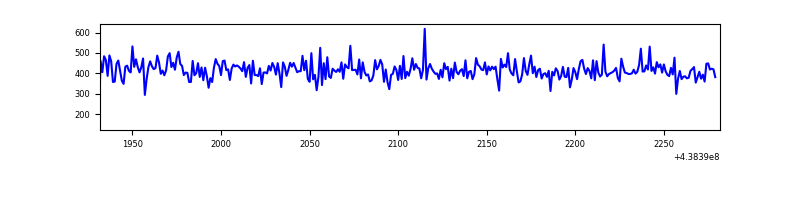 |
| D | 349 | 349 | 9 | 9 | 2.58% | 2.58% | 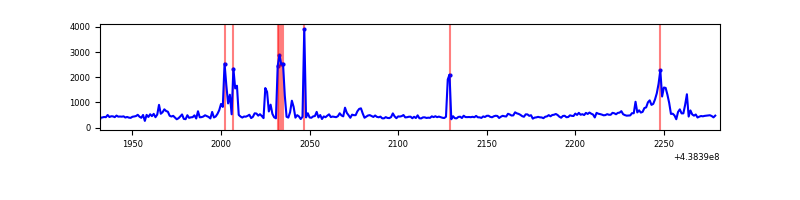 |
Top three noisy pixels from each quadrant. If the there are fewer than three noisy pixels in the level2.evt file, extra rows are filled as -1
| Pixel properties | Quadrant properties | ||||||
|---|---|---|---|---|---|---|---|
| Quadrant | DetID | PixID | Counts | Sigma | Mean | Median | Sigma |
| A | 10 | 83 | 55931 | 5636.1 | 37 | 37 | 9.9 |
| A | 7 | 3 | 658 | 62.62 | 37 | 37 | 9.9 |
| A | 12 | 227 | 574 | 54.15 | 37 | 37 | 9.9 |
| B | 12 | 111 | 894 | 90.63 | 37 | 36 | 9.5 |
| B | 14 | 111 | 806 | 81.34 | 37 | 36 | 9.5 |
| B | 11 | 111 | 803 | 81.02 | 37 | 36 | 9.5 |
| C | 3 | 233 | 717 | 65.91 | 36 | 36 | 10.3 |
| C | 13 | 61 | 254 | 21.1 | 36 | 36 | 10.3 |
| C | 9 | 237 | 249 | 20.61 | 36 | 36 | 10.3 |
| D | 13 | 249 | 59549 | 5456.0 | 35 | 34 | 10.9 |
| D | 1 | 52 | 7275 | 663.81 | 35 | 34 | 10.9 |
| D | 2 | 249 | 3971 | 360.92 | 35 | 34 | 10.9 |
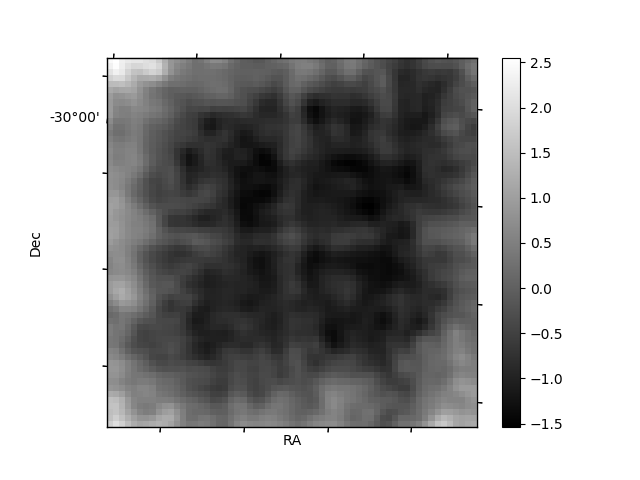
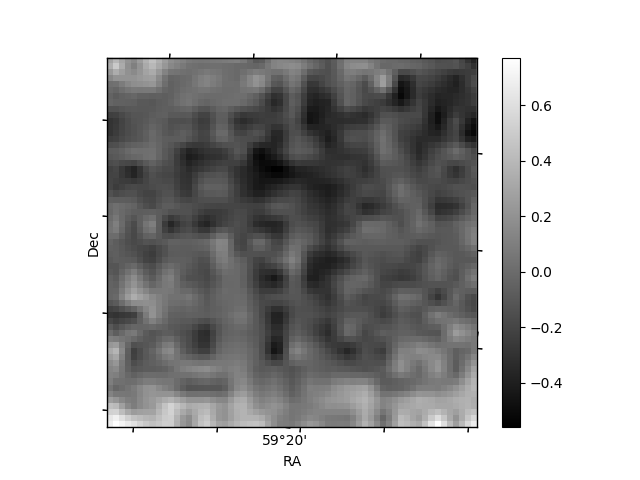
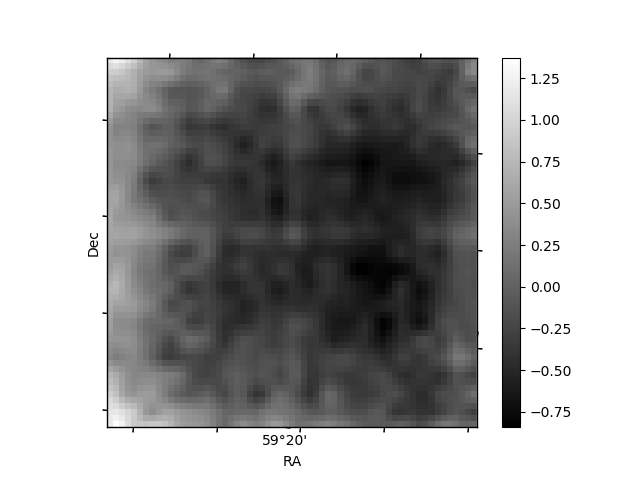
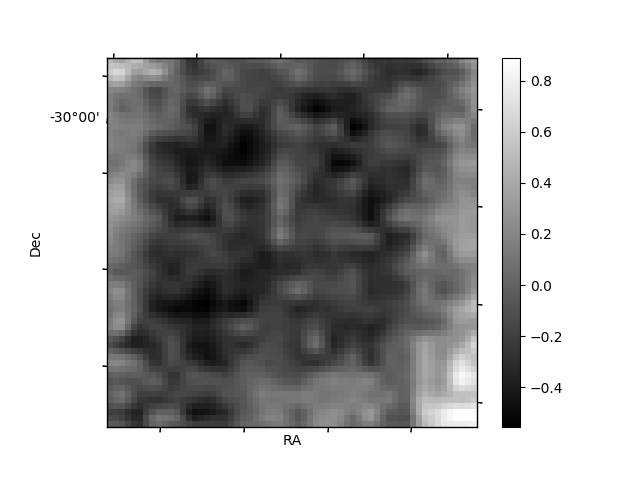
Histogram calculated using DETX and DETY for each event in the final _common_clean file
| Quadrant A | 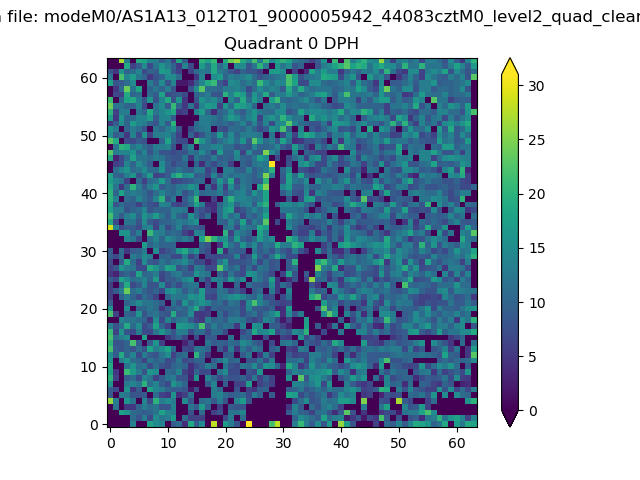 |
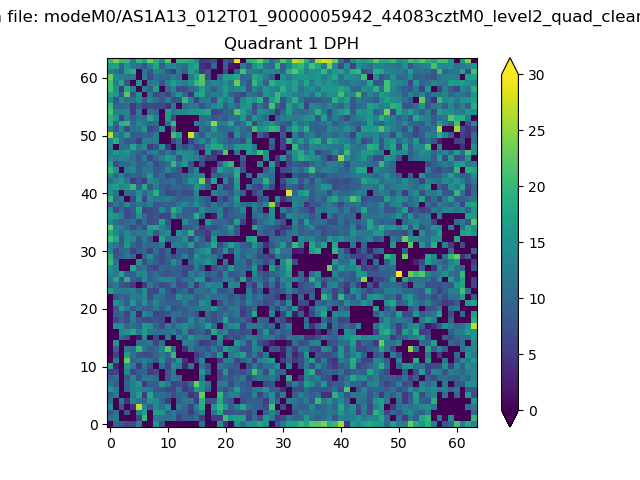 |
Quadrant B |
|---|---|---|---|
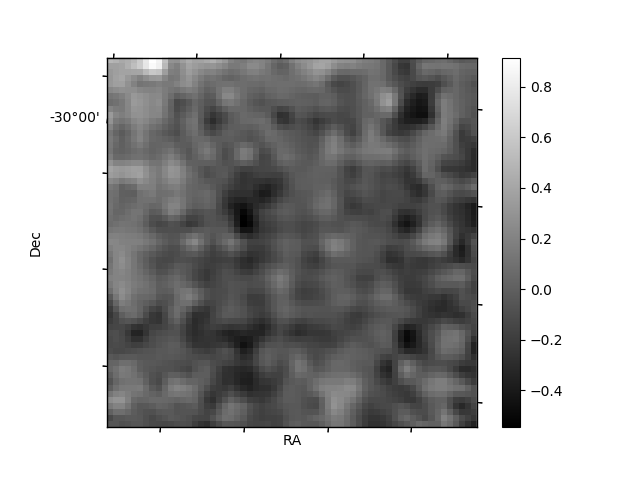
| Quadrant D | 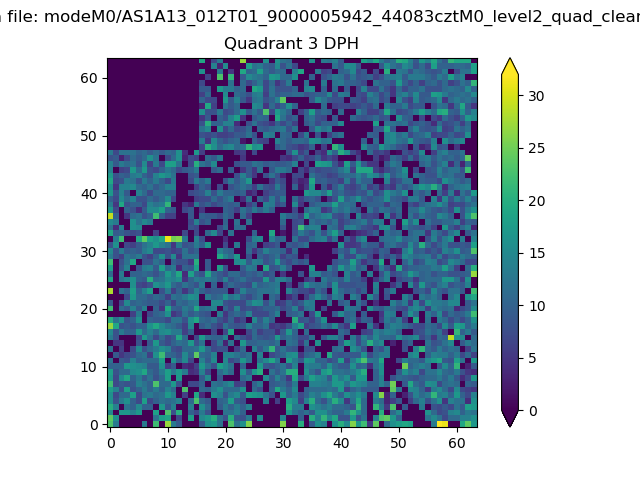 |
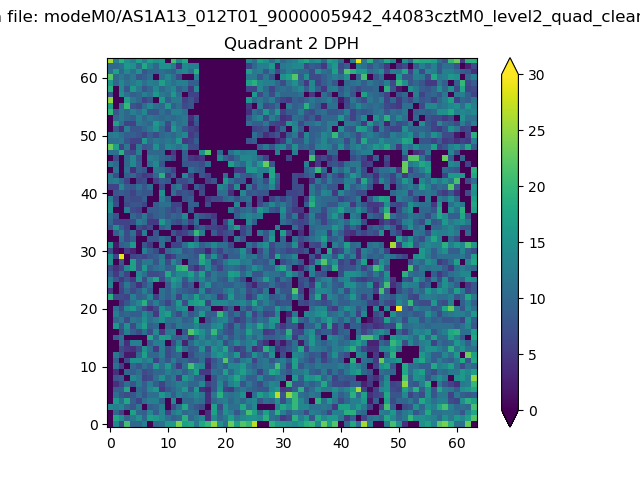 |
Quadrant C |
| Plot type | Count rate plots | Images |
|---|---|---|
| Comparison with Poisson distribution Blue bars denote a histogram of data divided into 1 sec bins. Red curve is a Poisson curve with rate = median count rate of data. |
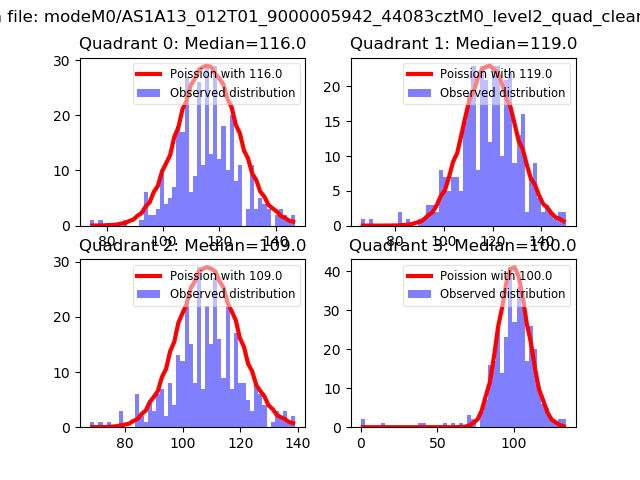 |
 |
| Quadrant-wise count rates Data is divided into 100 sec bins |
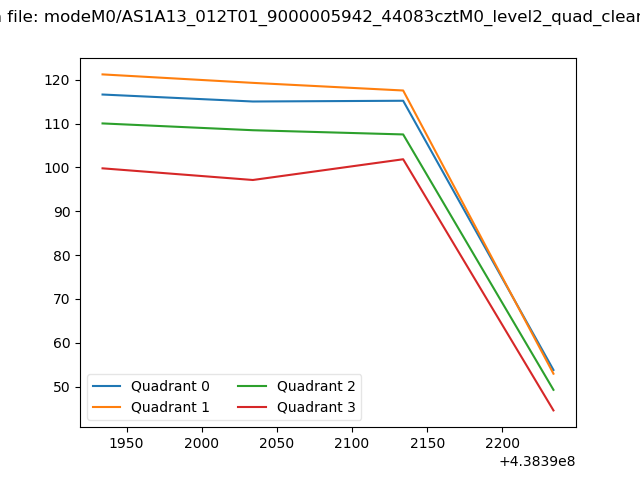 |
|
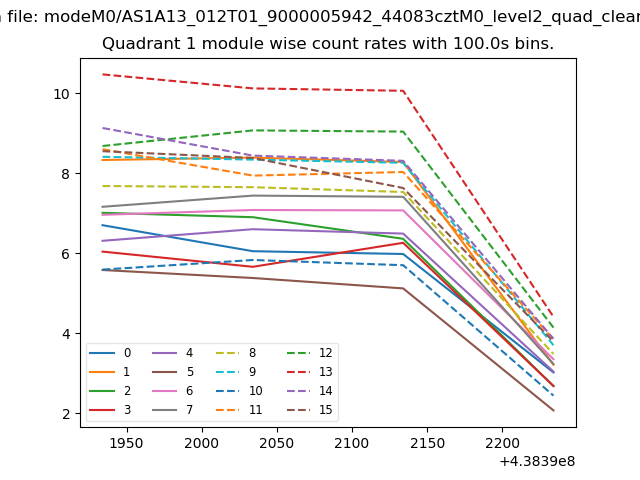
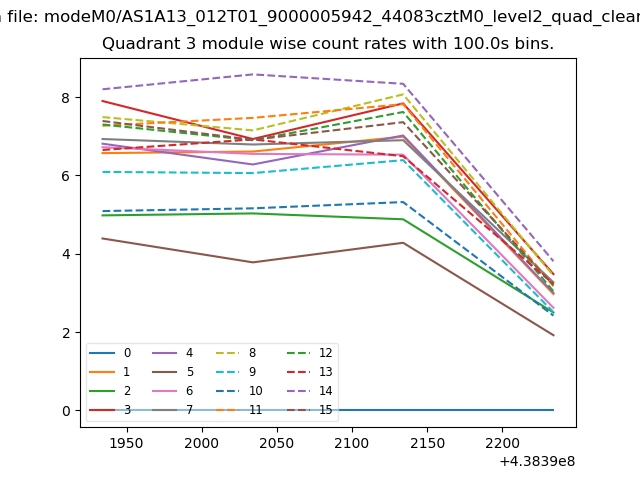
| Module-wise count rates for Quadrant A Data is divided into 100 sec bins |
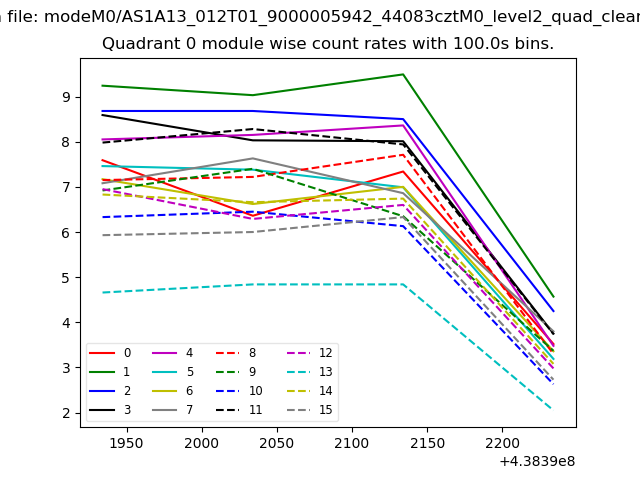 |
 |
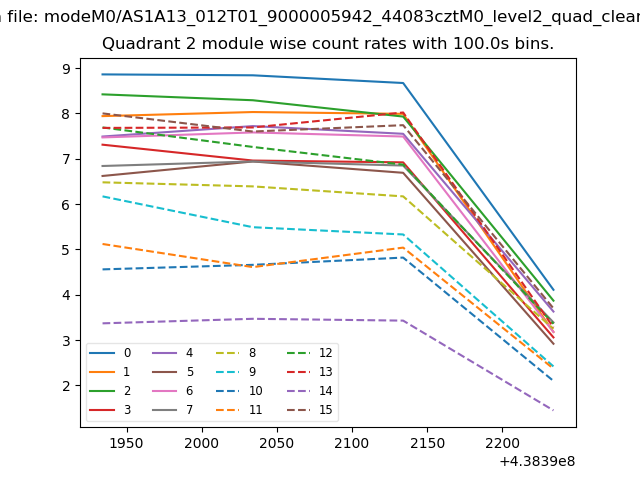
| Module-wise count rates for Quadrant B Data is divided into 100 sec bins |
 |
 |
| Module-wise count rates for Quadrant C Data is divided into 100 sec bins |
 |
 |
| Module-wise count rates for Quadrant D Data is divided into 100 sec bins |
 |
 |
| Parameter | Plot |
|---|---|
| CZT HV Monitor | 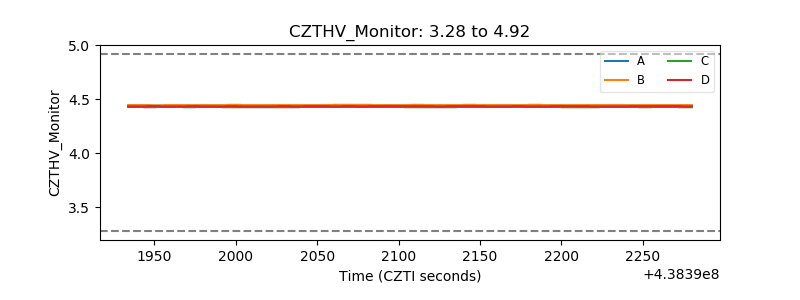 |
| D_VDD | 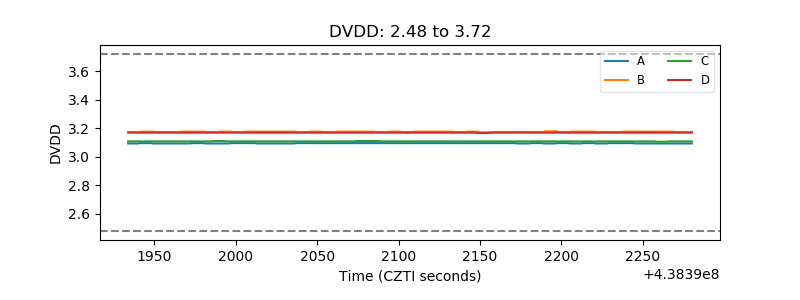 |
| Temperature 1 | 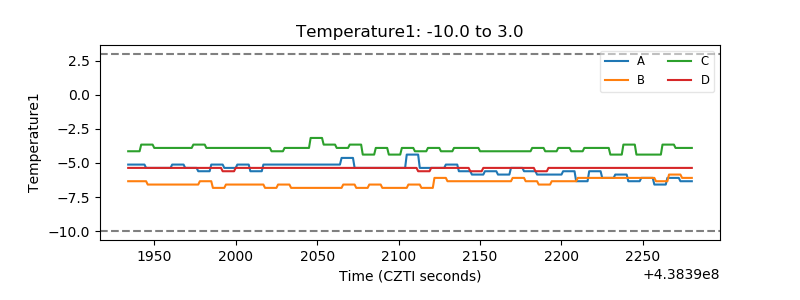 |
| Veto HV Monitor | 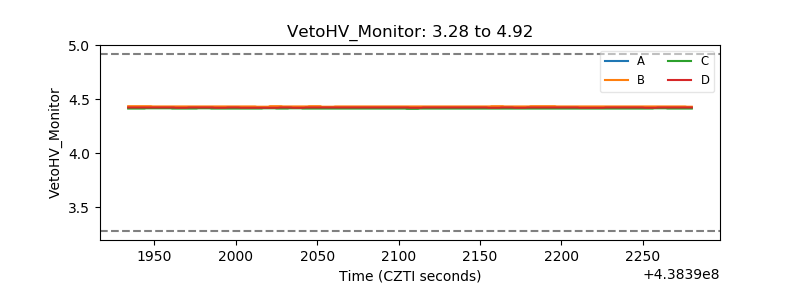 |
| Veto LLD | 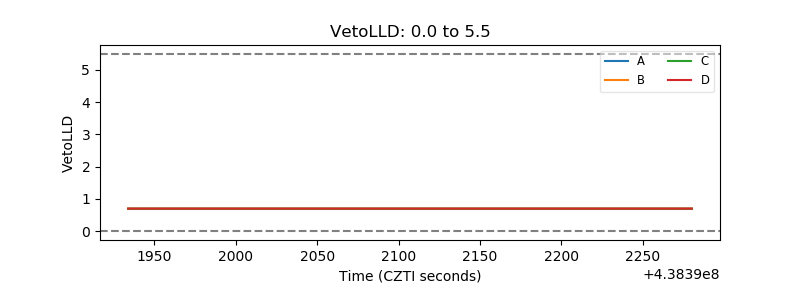 |
| Alpha Counter | 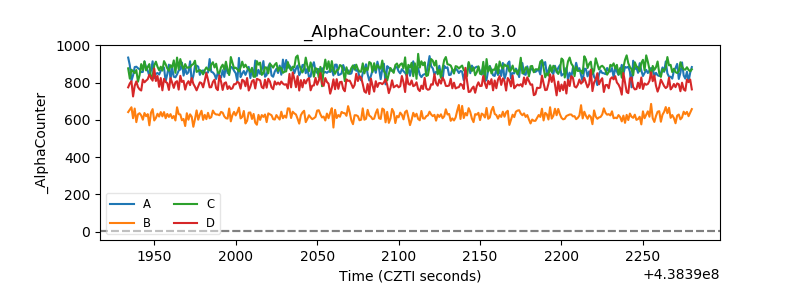 |
| _CPM_Rate | 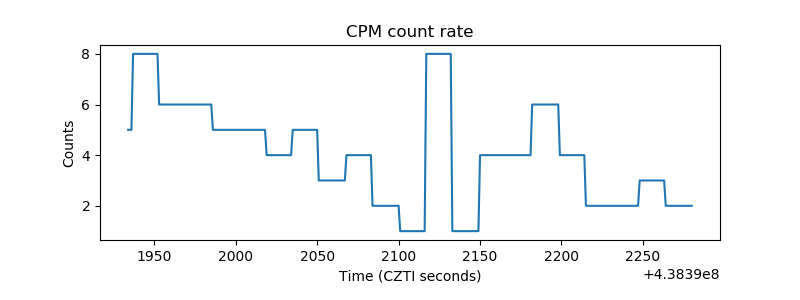 |
| CZT Counter | 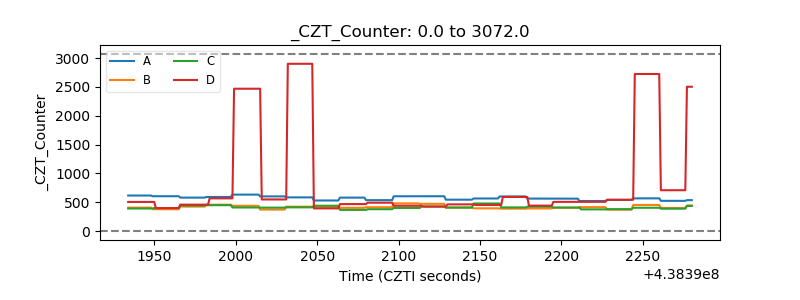 |
| +2.5 Volts monitor | 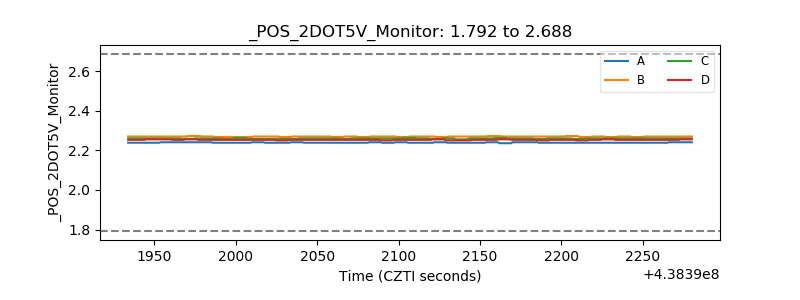 |
| +5 Volts monitor | 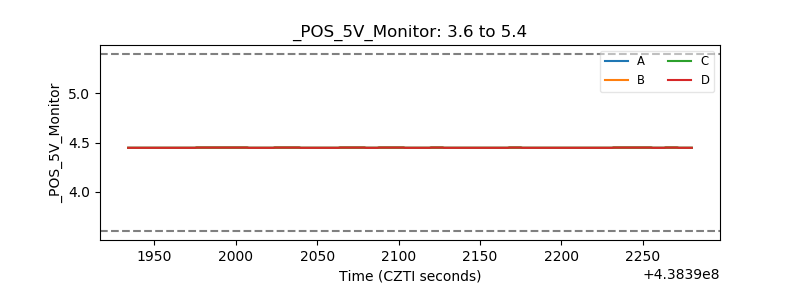 |
| _ROLL_ROT | 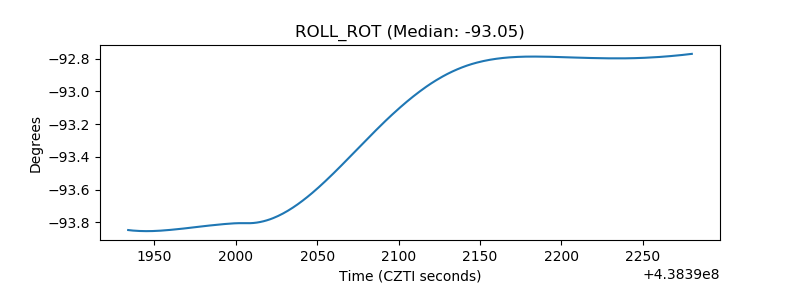 |
| _Roll_DEC | 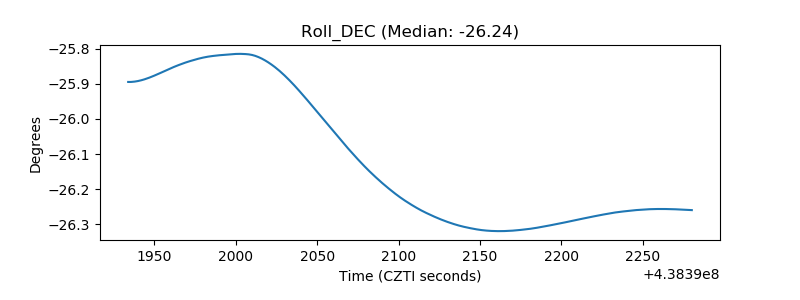 |
| _Roll_RA | 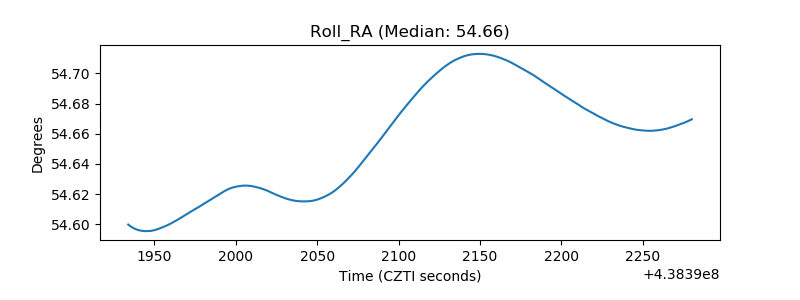 |
| Veto Counter | 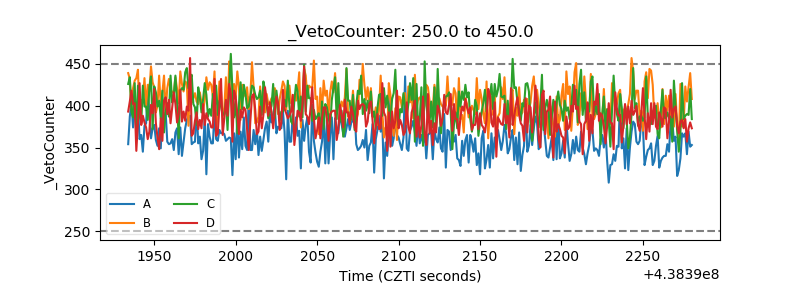 |