| Param | Original file | Final file |
|---|---|---|
| Filename | modeM0/AS1A13_077T01_9000005984_44463cztM0_level2.fits | modeM0/AS1A13_077T01_9000005984_44463cztM0_level2_quad_clean.evt |
| Size (bytes) | 506,733,120 | 123,693,120 |
| Size | 483.3 MB | 118.0 MB |
| Events in quadrant A | 5,501,246 | 821,437 |
| Events in quadrant B | 3,803,149 | 842,725 |
| Events in quadrant C | 3,844,949 | 808,784 |
| Events in quadrant D | 5,003,263 | 731,235 |
| Mode M0 | |||
|---|---|---|---|
| Quadrant | BADHDUFLAG | Total packets | Discarded packets |
| A | 0 | 23210 | 3 |
| B | 0 | 16657 | 3 |
| C | 0 | 16978 | 9 |
| D | 0 | 20342 | 3 |
| Mode M9 | |||
|---|---|---|---|
| Quadrant | BADHDUFLAG | Total packets | Discarded packets |
| A | 0 | 2 | 0 |
| B | 0 | 2 | 0 |
| C | 0 | 2 | 0 |
| D | 0 | 2 | 0 |
| Mode SS | |||
|---|---|---|---|
| Quadrant | BADHDUFLAG | Total packets | Discarded packets |
| A | 0 | 158 | 0 |
| B | 0 | 158 | 0 |
| C | 0 | 158 | 0 |
| D | 0 | 158 | 0 |
| Quadrant | Total seconds | Saturated seconds | Saturation percentage |
|---|---|---|---|
| A | 7786 | 360 | 4.623684% |
| B | 7787 | 330 | 4.237832% |
| C | 7786 | 251 | 3.223735% |
| D | 7786 | 440 | 5.651169% |
Noise dominated data is calculated using 1-second bins in cleaned event files. If a bin has >2000 counts, and if more than 50% of those come from <1% of pixels, then it is considered to be noise-dominated and hence unusable.
| Quadrant | # 1 sec bins | Bins with >0 counts | Bins with >2000 counts | High rate bins dominated by noise | Noise dominated (total time) | Noise dominated (detector-on time) | Marked lightcurve |
|---|---|---|---|---|---|---|---|
| A | 7881 | 7788 | 2 | 2 | 0.03% | 0.03% | 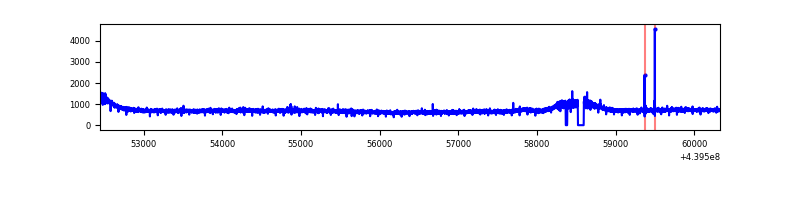 |
| B | 7882 | 7789 | 9 | 9 | 0.11% | 0.12% | 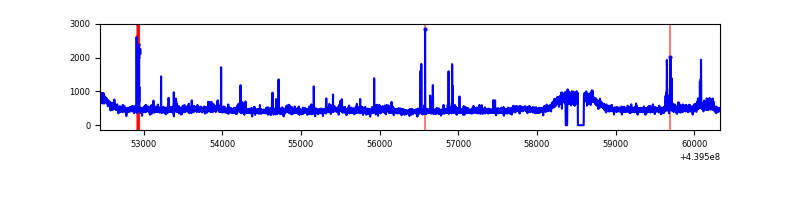 |
| C | 7881 | 7788 | 11 | 11 | 0.14% | 0.14% | 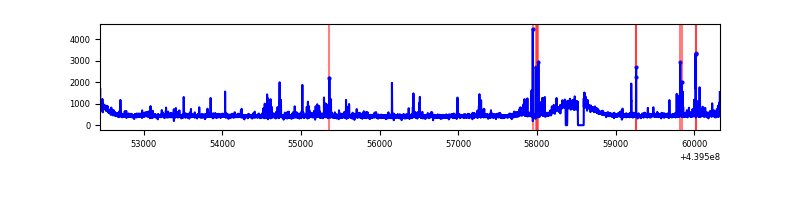 |
| D | 7881 | 7788 | 172 | 172 | 2.18% | 2.21% | 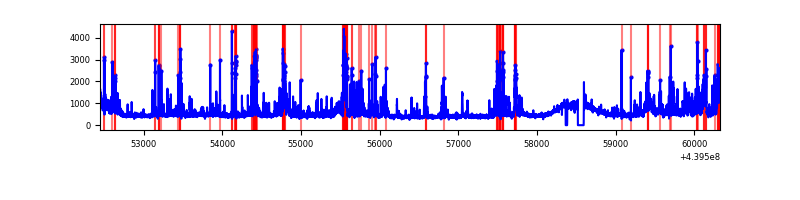 |
Top three noisy pixels from each quadrant. If the there are fewer than three noisy pixels in the level2.evt file, extra rows are filled as -1
| Pixel properties | Quadrant properties | ||||||
|---|---|---|---|---|---|---|---|
| Quadrant | DetID | PixID | Counts | Sigma | Mean | Median | Sigma |
| A | 10 | 83 | 1943167 | 10215.35 | 914 | 893 | 190.1 |
| A | 8 | 4 | 12548 | 61.3 | 914 | 893 | 190.1 |
| A | 0 | 243 | 11041 | 53.37 | 914 | 893 | 190.1 |
| B | 0 | 229 | 75463 | 408.35 | 907 | 877 | 182.7 |
| B | 5 | 172 | 42341 | 227.01 | 907 | 877 | 182.7 |
| B | 7 | 221 | 29376 | 156.03 | 907 | 877 | 182.7 |
| C | 14 | 254 | 178602 | 830.25 | 902 | 904 | 214.0 |
| C | 12 | 16 | 85962 | 397.41 | 902 | 904 | 214.0 |
| C | 3 | 233 | 37734 | 172.08 | 902 | 904 | 214.0 |
| D | 1 | 52 | 485364 | 2109.12 | 900 | 870 | 229.7 |
| D | 2 | 249 | 343108 | 1489.84 | 900 | 870 | 229.7 |
| D | 13 | 249 | 237973 | 1032.17 | 900 | 870 | 229.7 |
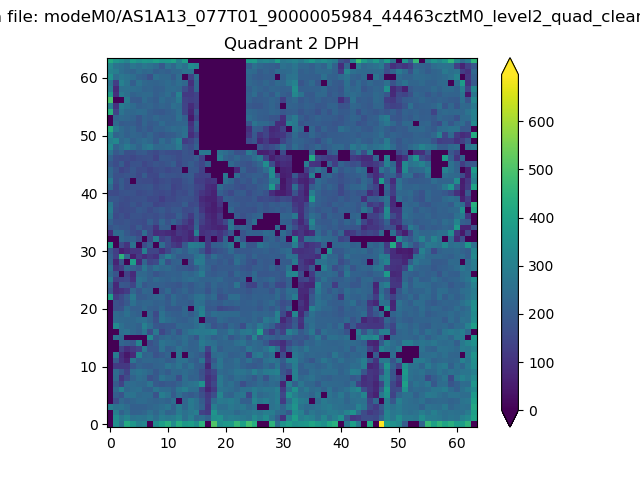
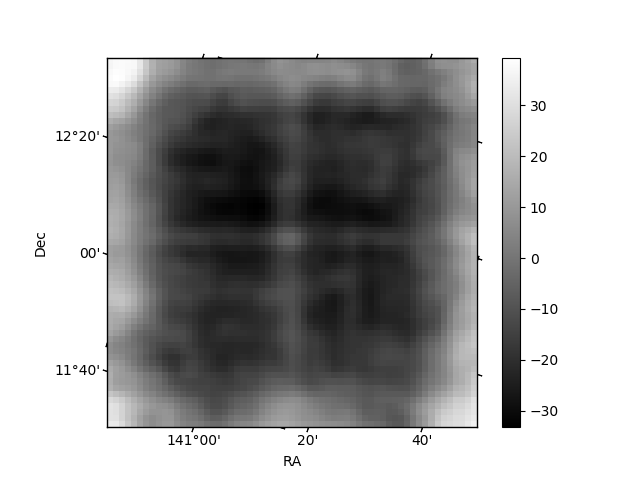
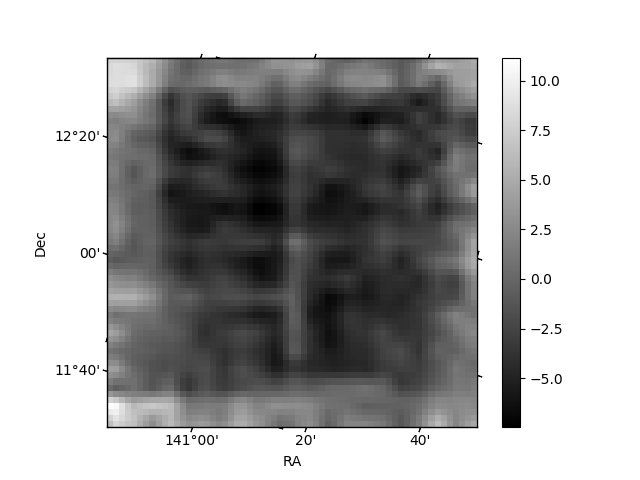
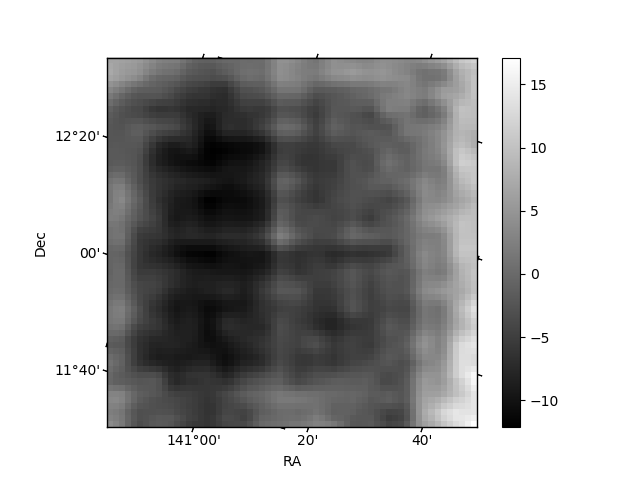
Histogram calculated using DETX and DETY for each event in the final _common_clean file
| Quadrant A | 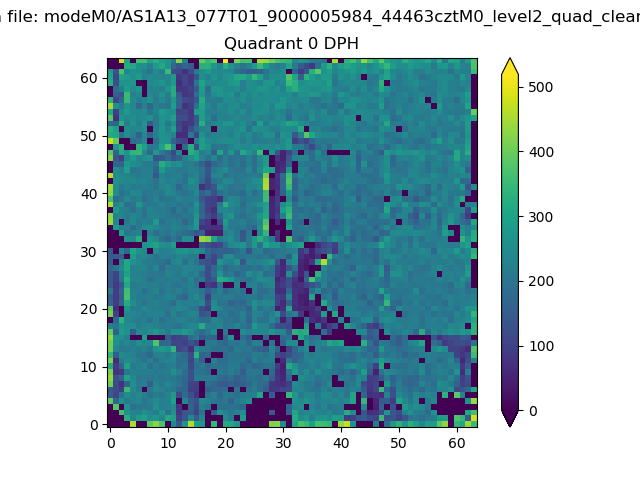 |
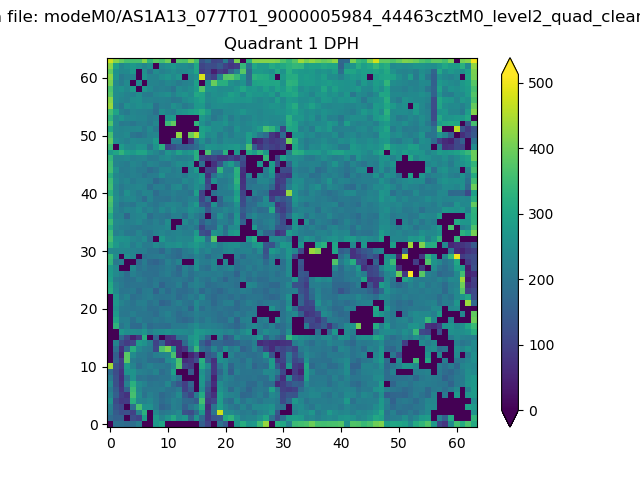 |
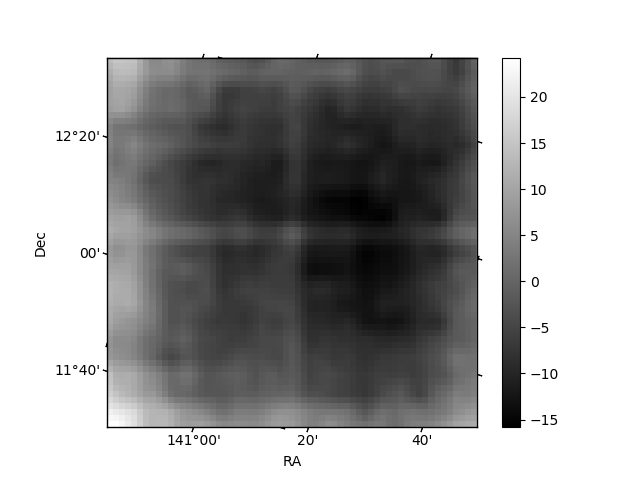
Quadrant B |
|---|---|---|---|
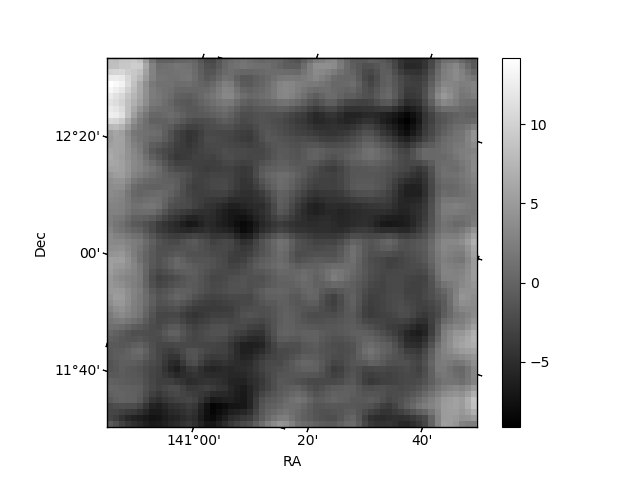
| Quadrant D | 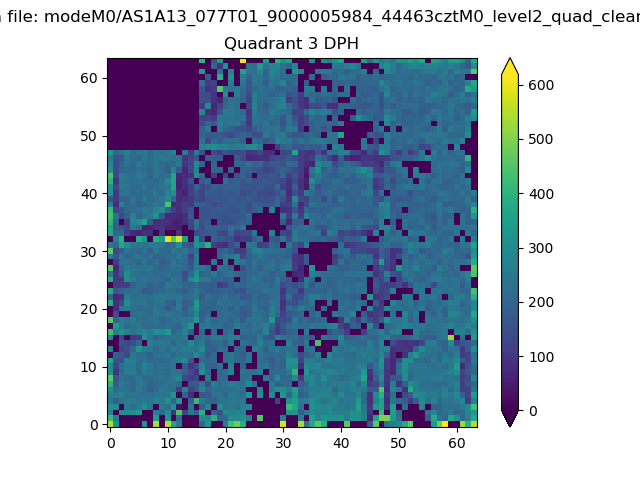 |
 |
Quadrant C |
| Plot type | Count rate plots | Images |
|---|---|---|
| Comparison with Poisson distribution Blue bars denote a histogram of data divided into 1 sec bins. Red curve is a Poisson curve with rate = median count rate of data. |
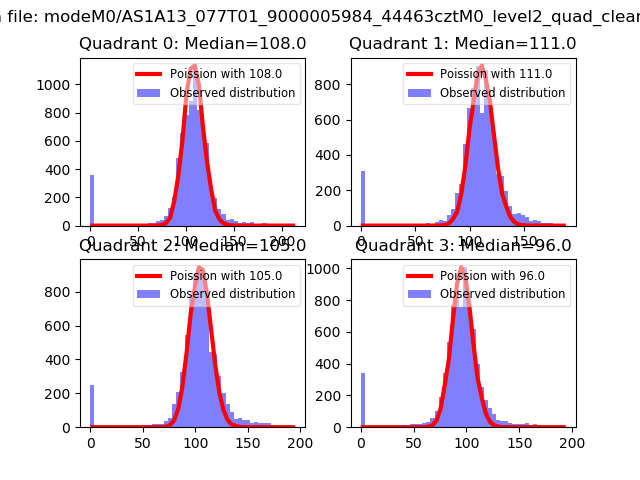 |
 |
| Quadrant-wise count rates Data is divided into 100 sec bins |
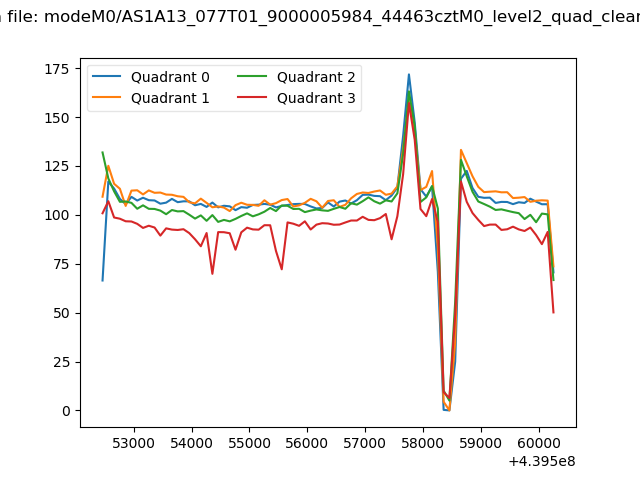 |
|
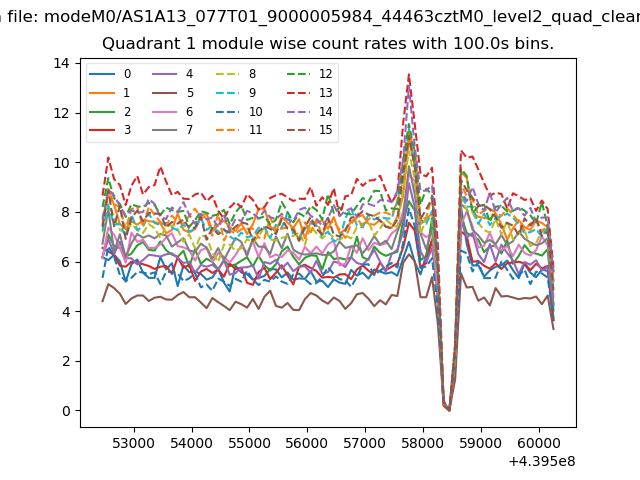
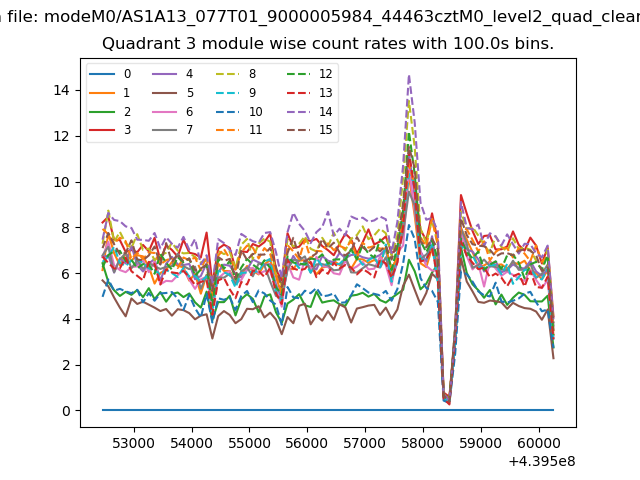
| Module-wise count rates for Quadrant A Data is divided into 100 sec bins |
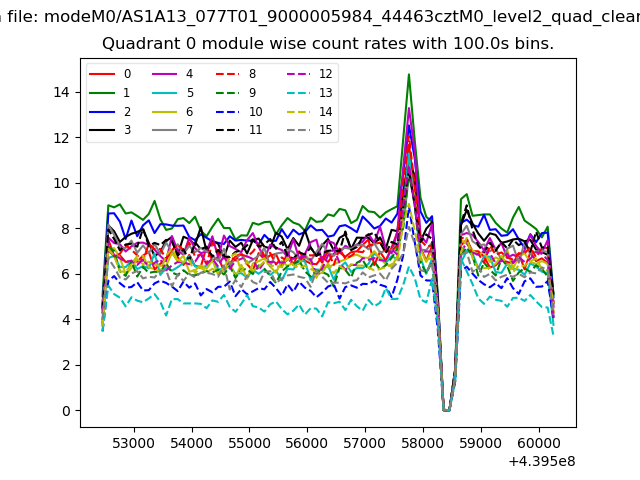 |
 |
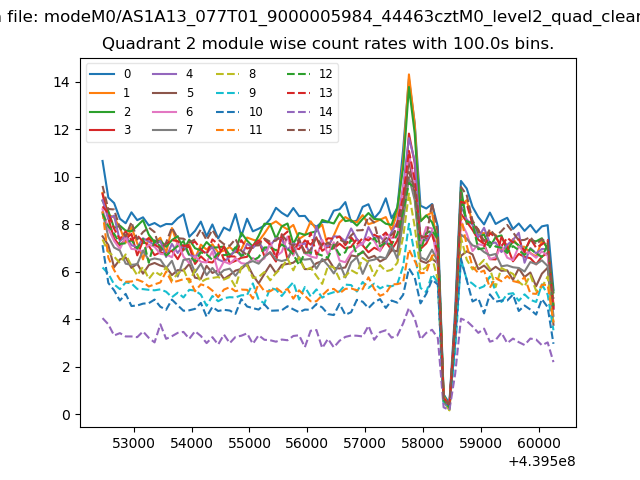
| Module-wise count rates for Quadrant B Data is divided into 100 sec bins |
 |
 |
| Module-wise count rates for Quadrant C Data is divided into 100 sec bins |
 |
 |
| Module-wise count rates for Quadrant D Data is divided into 100 sec bins |
 |
 |
| Parameter | Plot |
|---|---|
| CZT HV Monitor | 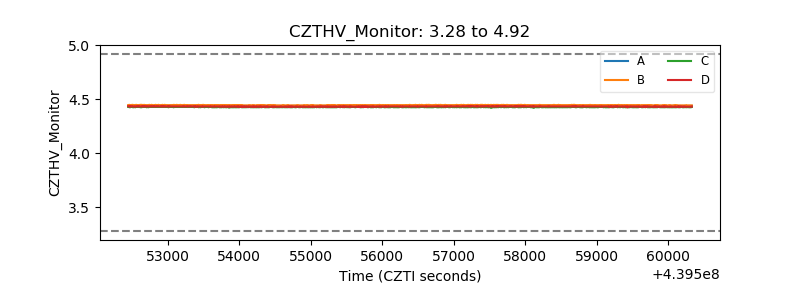 |
| D_VDD | 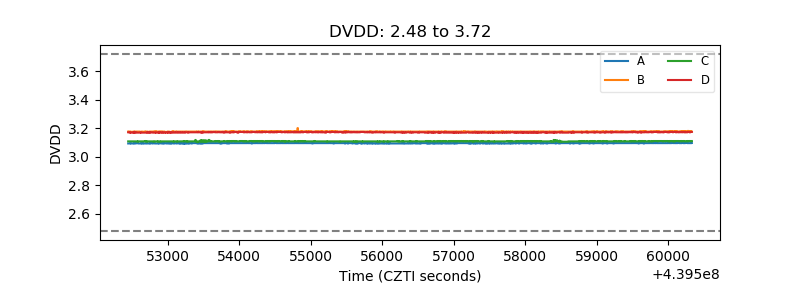 |
| Temperature 1 | 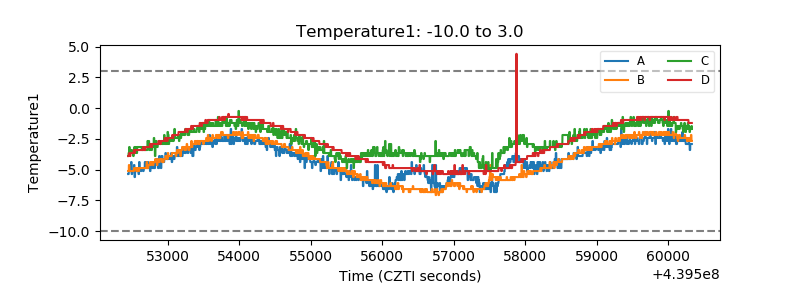 |
| Veto HV Monitor | 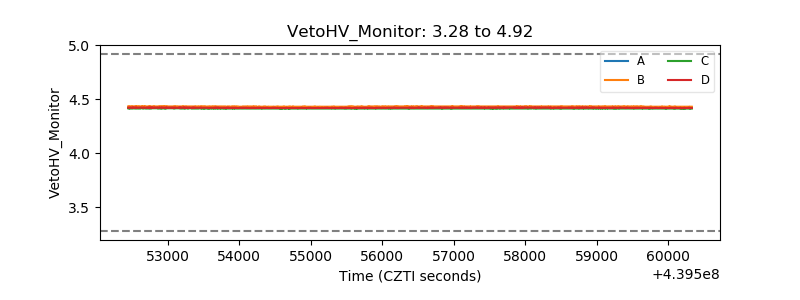 |
| Veto LLD | 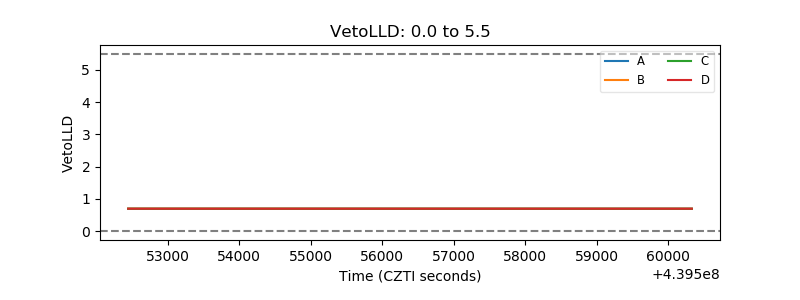 |
| Alpha Counter | 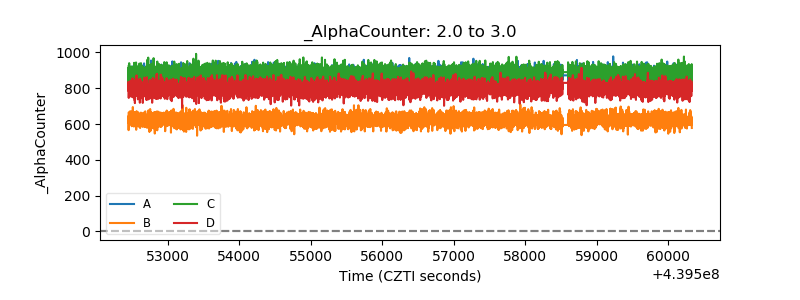 |
| _CPM_Rate | 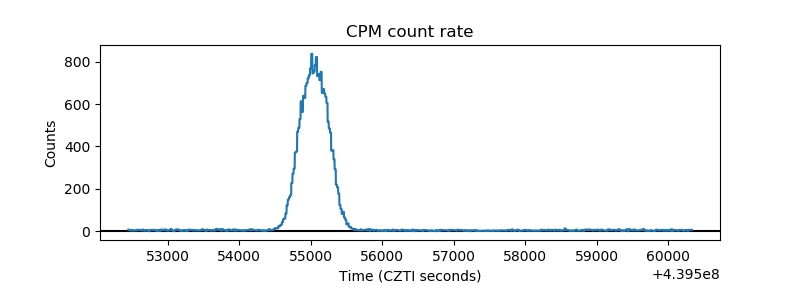 |
| CZT Counter | 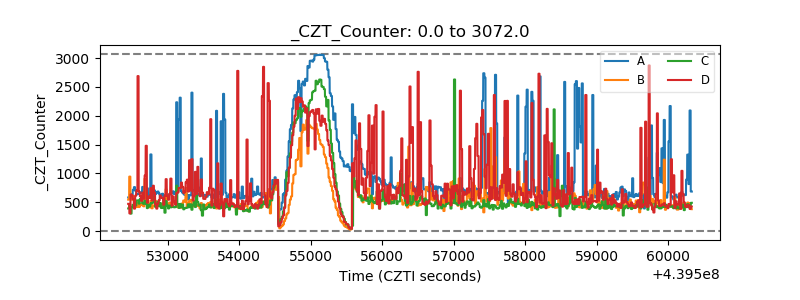 |
| +2.5 Volts monitor | 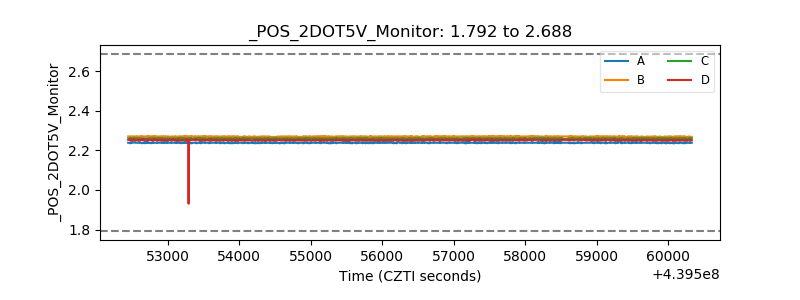 |
| +5 Volts monitor | 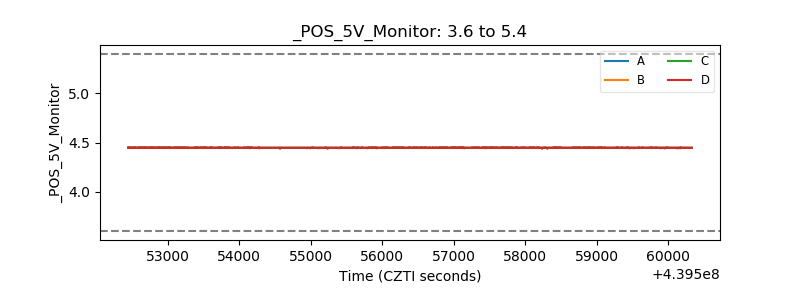 |
| _ROLL_ROT |  |
| _Roll_DEC | 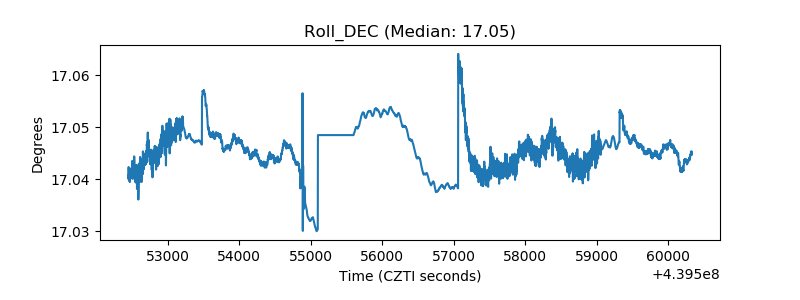 |
| _Roll_RA | 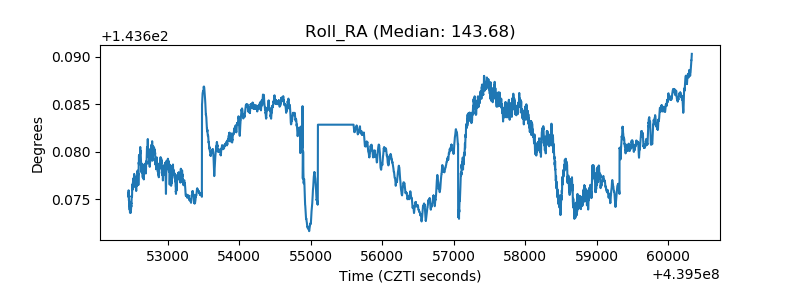 |
| Veto Counter | 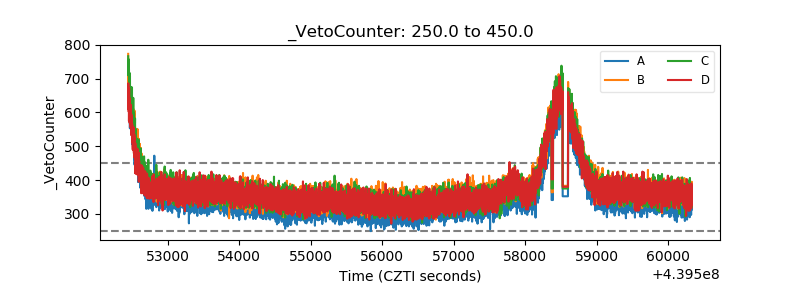 |