| Param | Original file | Final file |
|---|---|---|
| Filename | modeM0/AS1A13_017T01_9000006028_48101cztM0_level2.fits | modeM0/AS1A13_017T01_9000006028_48101cztM0_level2_quad_clean.evt |
| Size (bytes) | 430,565,760 | 87,822,720 |
| Size | 410.6 MB | 83.8 MB |
| Events in quadrant A | 7,345,892 | 732,056 |
| Events in quadrant B | 1,231,954 | 46,884 |
| Events in quadrant C | 3,035,416 | 734,025 |
| Events in quadrant D | 3,779,633 | 661,146 |
| Mode M0 | |||
|---|---|---|---|
| Quadrant | BADHDUFLAG | Total packets | Discarded packets |
| A | 0 | 26401 | 4 |
| B | 0 | 7513 | 2 |
| C | 0 | 14266 | 2 |
| D | 0 | 16496 | 2 |
| Mode SS | |||
|---|---|---|---|
| Quadrant | BADHDUFLAG | Total packets | Discarded packets |
| A | 0 | 140 | 0 |
| B | 0 | 140 | 0 |
| C | 0 | 140 | 0 |
| D | 0 | 140 | 0 |
| Mode M9 | |||
|---|---|---|---|
| Quadrant | BADHDUFLAG | Total packets | Discarded packets |
| A | 0 | 12 | 0 |
| B | 0 | 13 | 0 |
| C | 0 | 13 | 0 |
| D | 0 | 13 | 0 |
| Quadrant | Total seconds | Saturated seconds | Saturation percentage |
|---|---|---|---|
| A | 6909 | 420 | 6.079027% |
| B | 6909 | 6909 | 100.000000% |
| C | 6909 | 33 | 0.477638% |
| D | 6909 | 218 | 3.155305% |
Noise dominated data is calculated using 1-second bins in cleaned event files. If a bin has >2000 counts, and if more than 50% of those come from <1% of pixels, then it is considered to be noise-dominated and hence unusable.
| Quadrant | # 1 sec bins | Bins with >0 counts | Bins with >2000 counts | High rate bins dominated by noise | Noise dominated (total time) | Noise dominated (detector-on time) | Marked lightcurve |
|---|---|---|---|---|---|---|---|
| A | 7739 | 6910 | 120 | 120 | 1.55% | 1.74% | 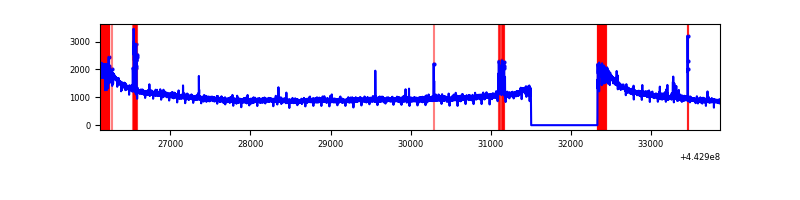 |
| B | 7738 | 6884 | 2 | 2 | 0.03% | 0.03% | 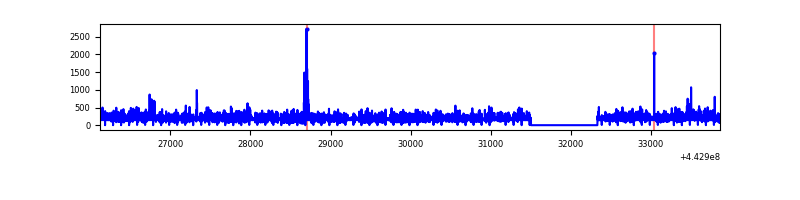 |
| C | 7739 | 6910 | 6 | 6 | 0.08% | 0.09% | 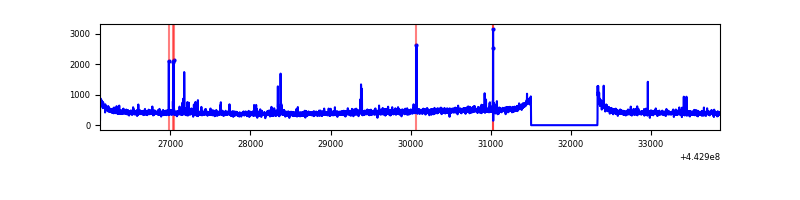 |
| D | 7739 | 6910 | 119 | 119 | 1.54% | 1.72% | 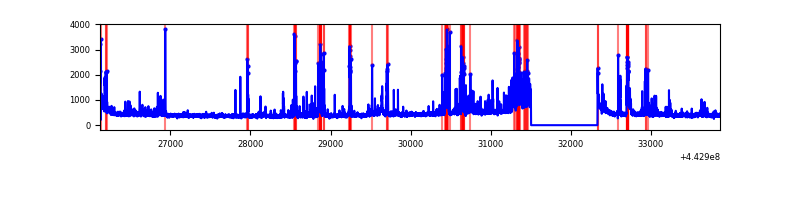 |
Top three noisy pixels from each quadrant. If the there are fewer than three noisy pixels in the level2.evt file, extra rows are filled as -1
| Pixel properties | Quadrant properties | ||||||
|---|---|---|---|---|---|---|---|
| Quadrant | DetID | PixID | Counts | Sigma | Mean | Median | Sigma |
| A | 10 | 83 | 4310777 | 27260.02 | 750 | 734 | 158.1 |
| A | 14 | 248 | 63890 | 399.45 | 750 | 734 | 158.1 |
| A | 13 | 248 | 49545 | 308.72 | 750 | 734 | 158.1 |
| B | 2 | 177 | 951740 | 78994.37 | 50 | 48 | 12.0 |
| B | 5 | 32 | 28915 | 2396.08 | 50 | 48 | 12.0 |
| B | 0 | 200 | 23549 | 1950.68 | 50 | 48 | 12.0 |
| C | 14 | 254 | 42744 | 237.12 | 753 | 756 | 177.1 |
| C | 12 | 250 | 23470 | 128.28 | 753 | 756 | 177.1 |
| C | 12 | 2 | 15080 | 80.89 | 753 | 756 | 177.1 |
| D | 2 | 165 | 393912 | 2135.07 | 735 | 711 | 184.2 |
| D | 2 | 249 | 272267 | 1474.54 | 735 | 711 | 184.2 |
| D | 11 | 224 | 149466 | 807.73 | 735 | 711 | 184.2 |
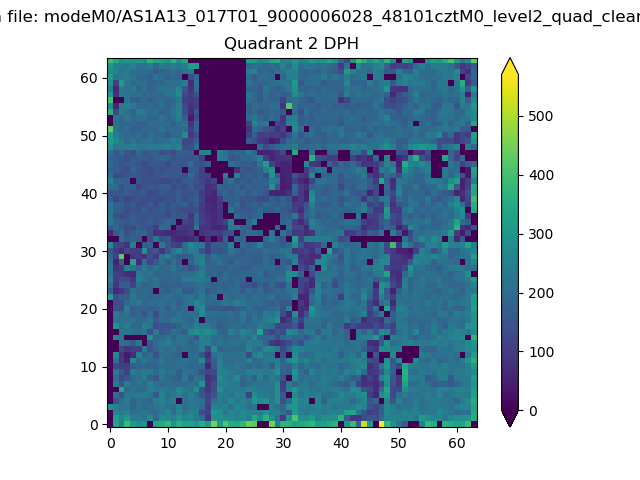
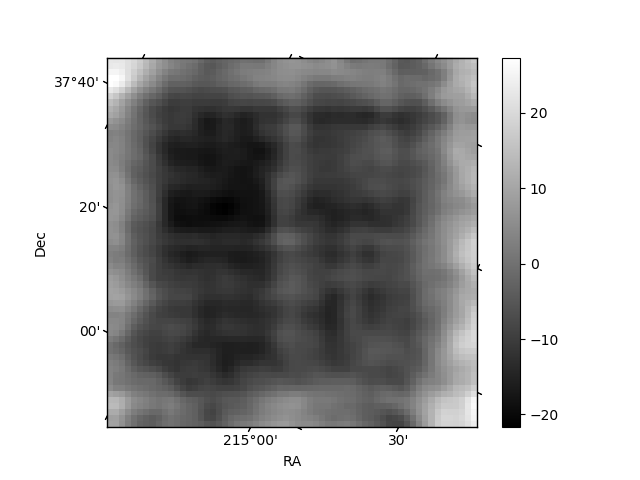
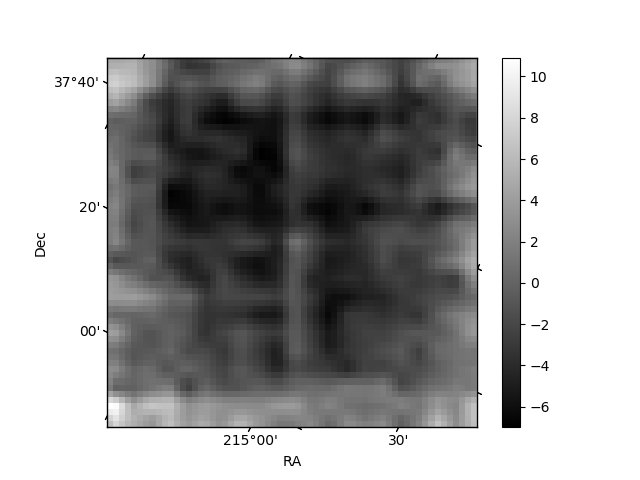
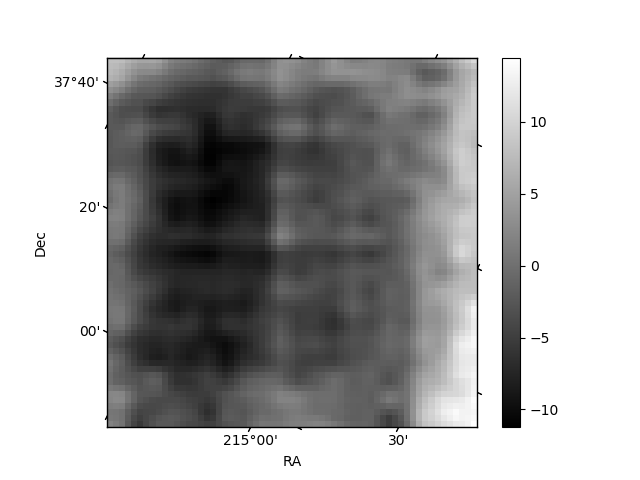
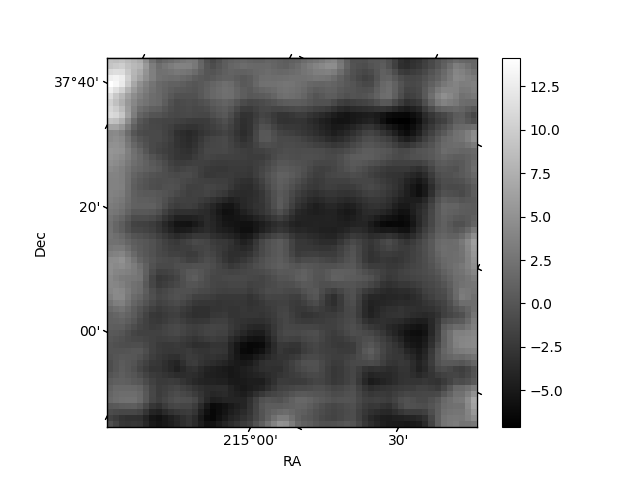
Histogram calculated using DETX and DETY for each event in the final _common_clean file
| Quadrant A | 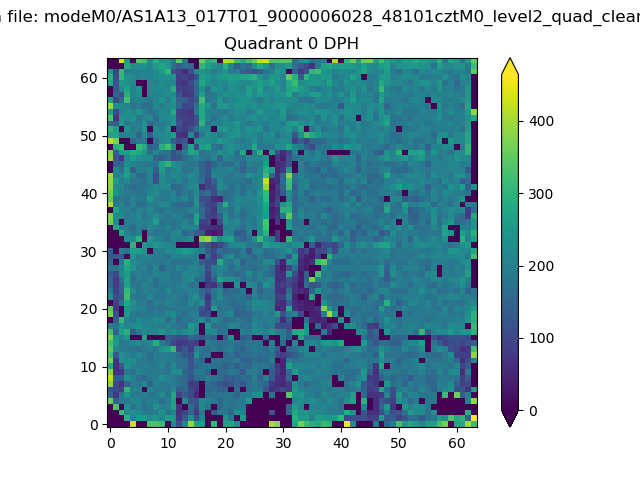 |
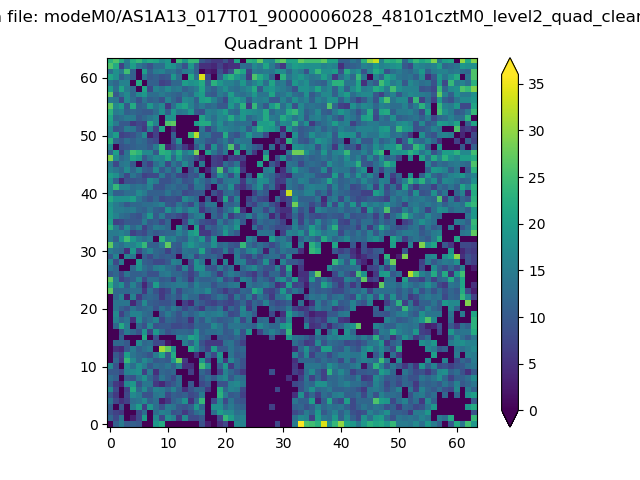 |
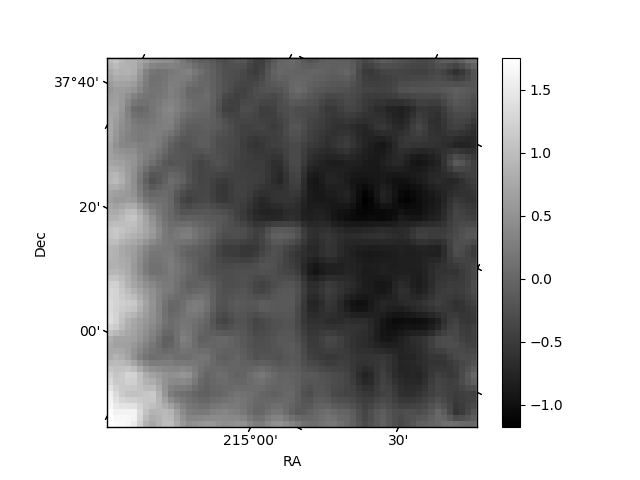
Quadrant B |
|---|---|---|---|
| Quadrant D | 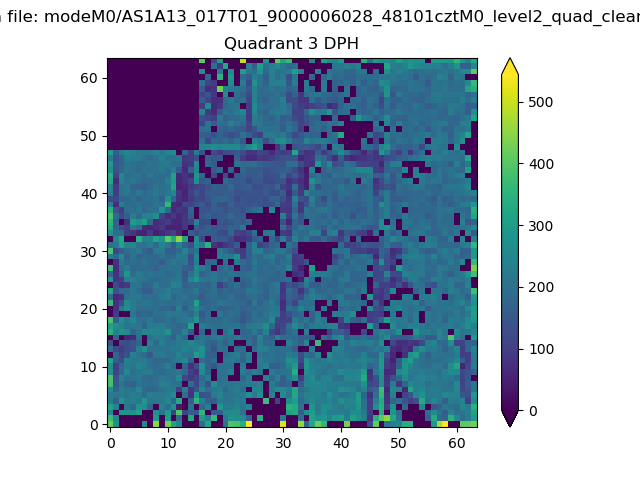 |
 |
Quadrant C |
| Plot type | Count rate plots | Images |
|---|---|---|
| Comparison with Poisson distribution Blue bars denote a histogram of data divided into 1 sec bins. Red curve is a Poisson curve with rate = median count rate of data. |
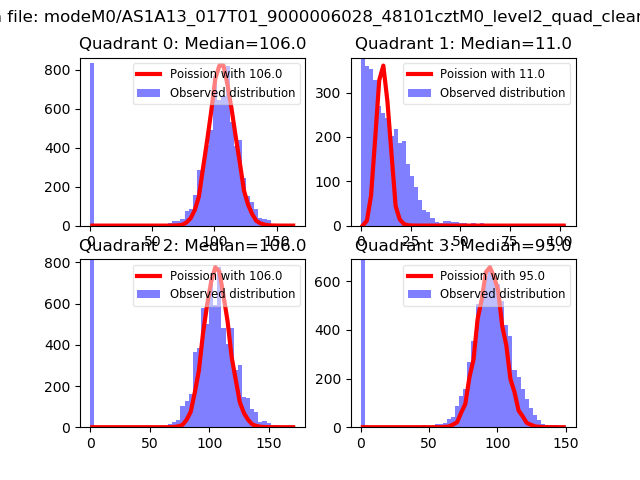 |
 |
| Quadrant-wise count rates Data is divided into 100 sec bins |
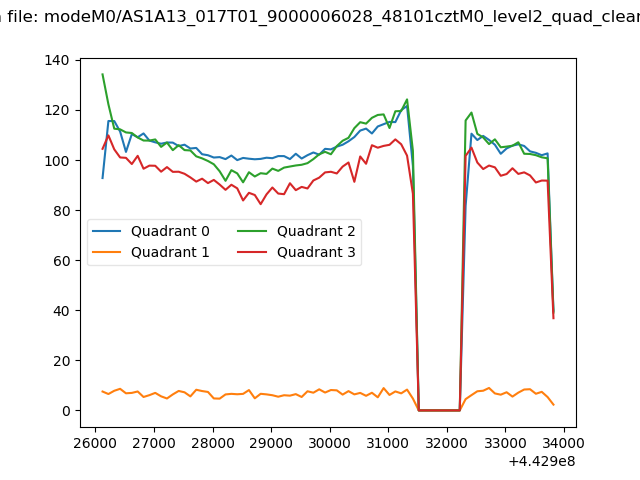 |
|
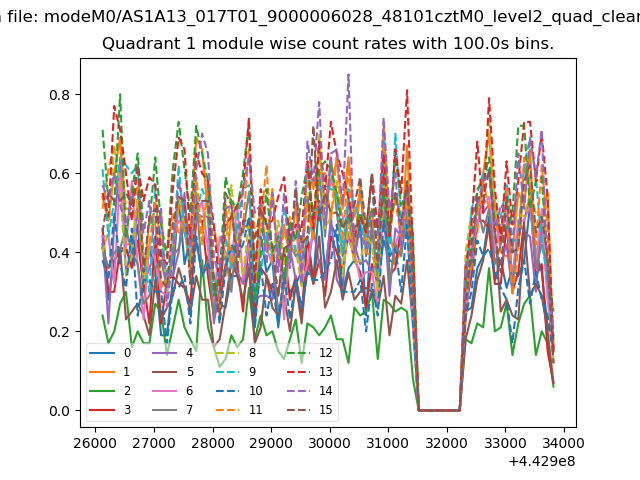
| Module-wise count rates for Quadrant A Data is divided into 100 sec bins |
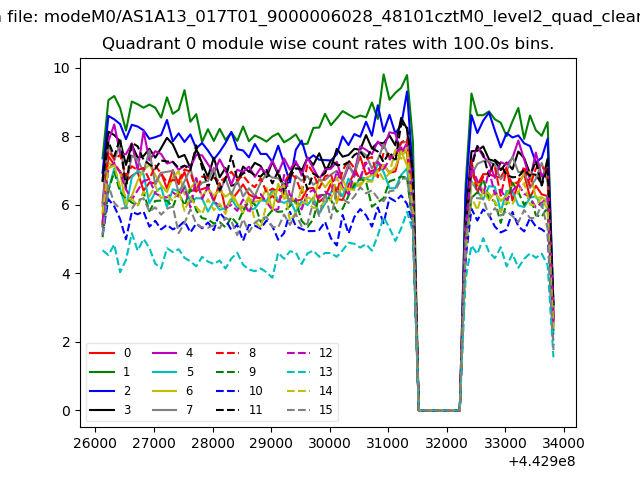 |
 |
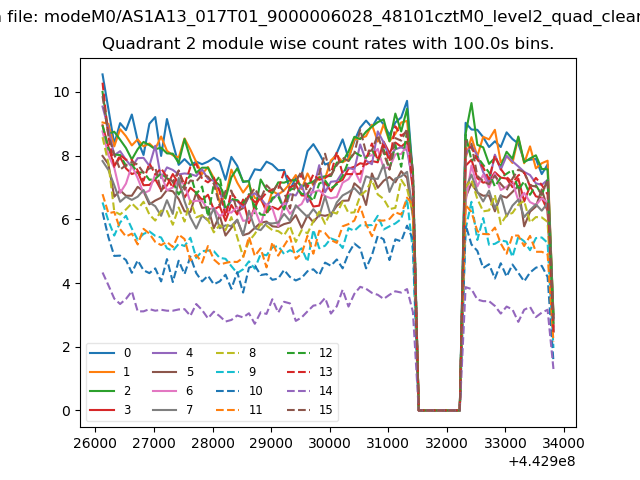
| Module-wise count rates for Quadrant B Data is divided into 100 sec bins |
 |
 |
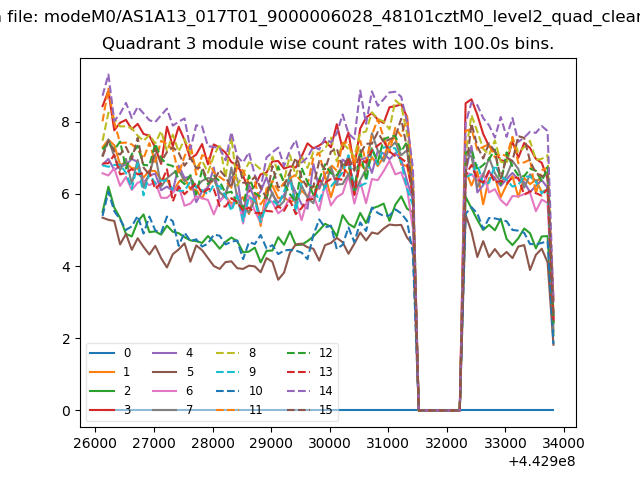
| Module-wise count rates for Quadrant C Data is divided into 100 sec bins |
 |
 |
| Module-wise count rates for Quadrant D Data is divided into 100 sec bins |
 |
 |
| Parameter | Plot |
|---|---|
| CZT HV Monitor | 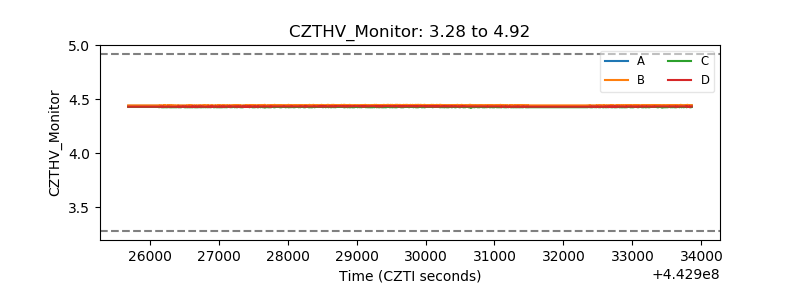 |
| D_VDD | 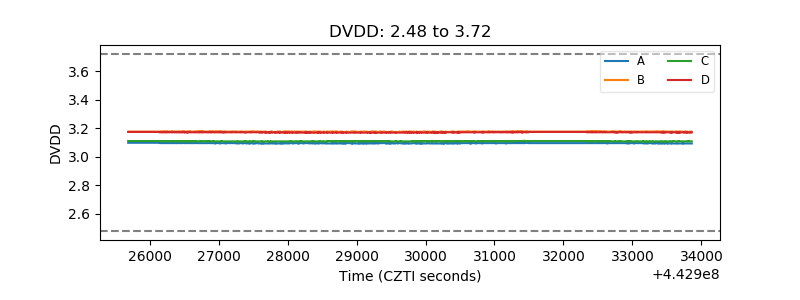 |
| Temperature 1 | 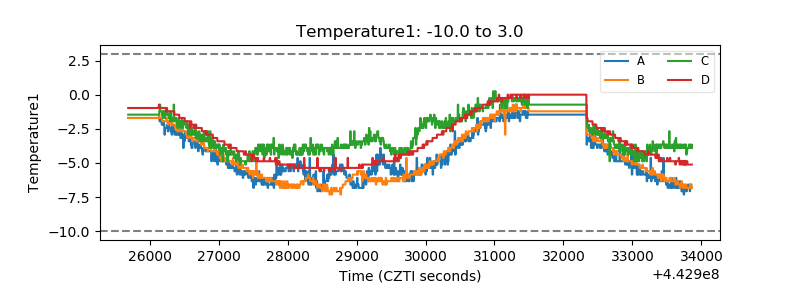 |
| Veto HV Monitor | 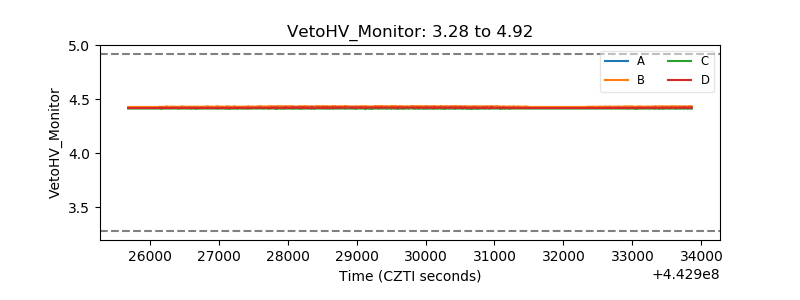 |
| Veto LLD | 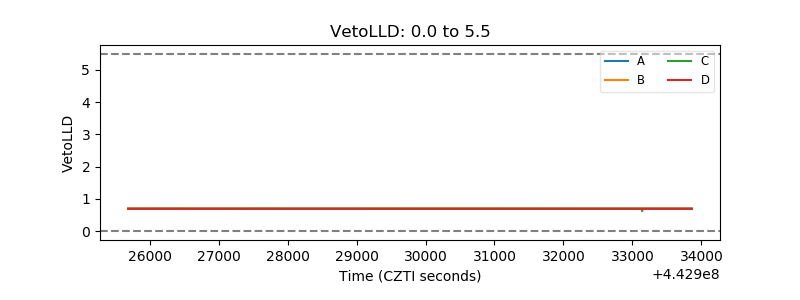 |
| Alpha Counter | 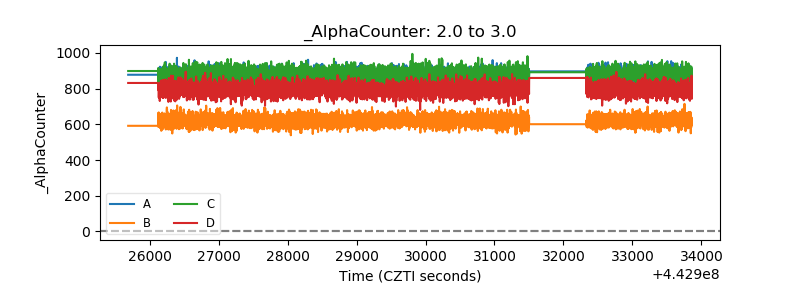 |
| _CPM_Rate | 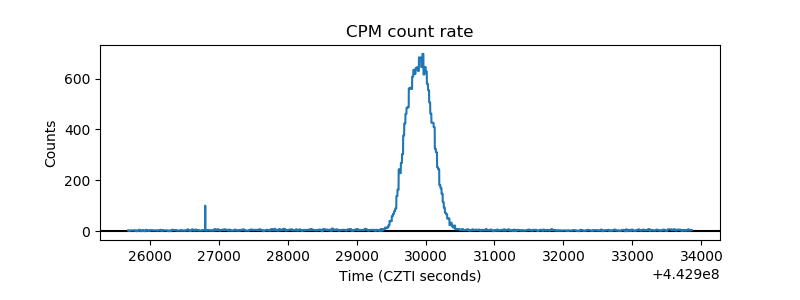 |
| CZT Counter | 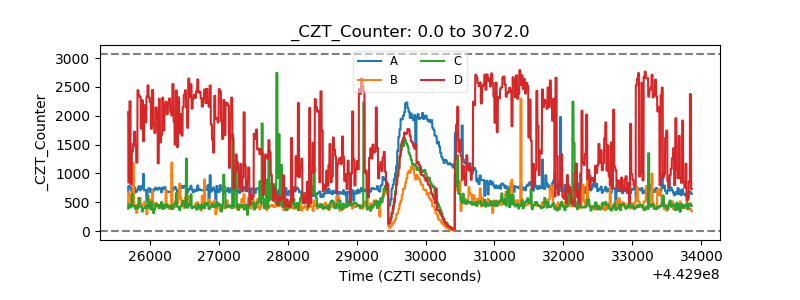 |
| +2.5 Volts monitor | 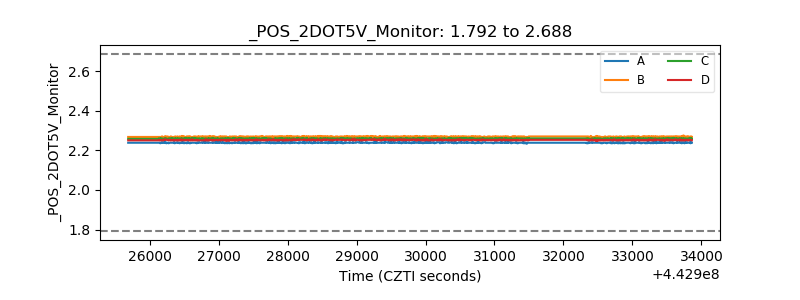 |
| +5 Volts monitor | 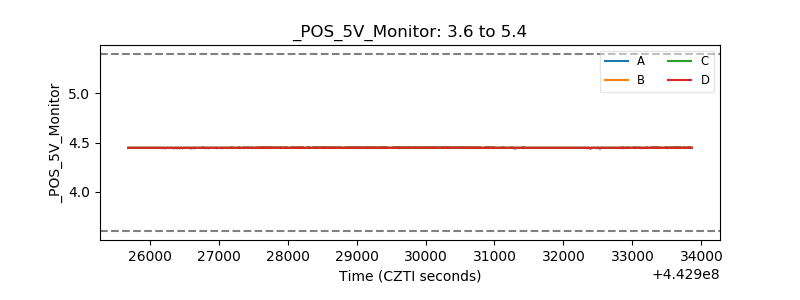 |
| _ROLL_ROT | 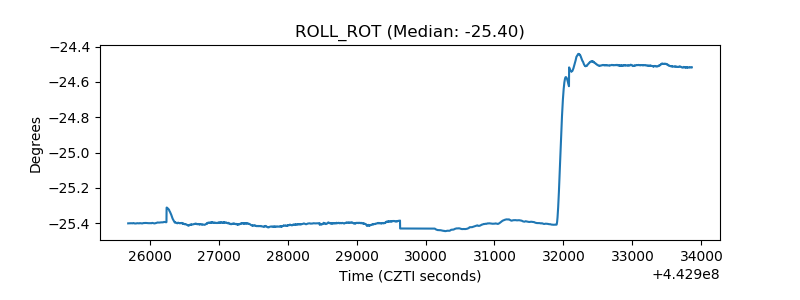 |
| _Roll_DEC | 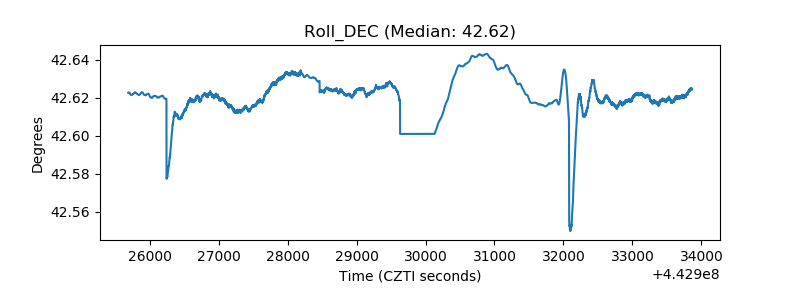 |
| _Roll_RA | 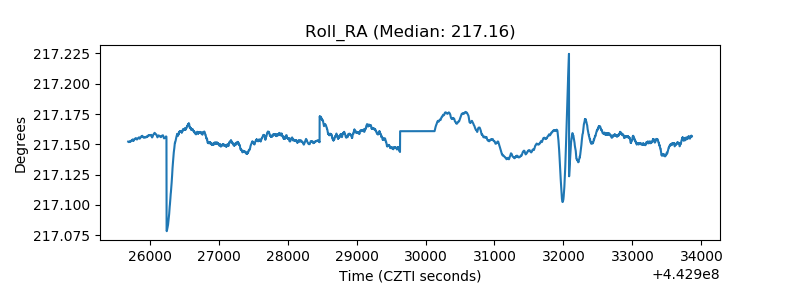 |
| Veto Counter | 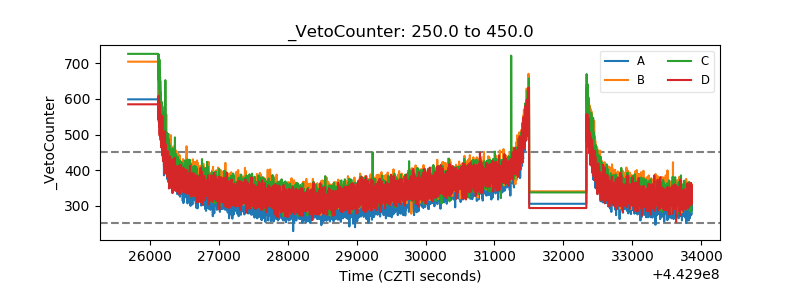 |