| Param | Original file | Final file |
|---|---|---|
| Filename | modeM0/AS1A13_049T06_9000006054_45194cztM0_level2.fits | modeM0/AS1A13_049T06_9000006054_45194cztM0_level2_quad_clean.evt |
| Size (bytes) | 39,991,680 | 8,593,920 |
| Size | 38.1 MB | 8.2 MB |
| Events in quadrant A | 376,117 | 56,248 |
| Events in quadrant B | 234,164 | 57,257 |
| Events in quadrant C | 211,393 | 54,564 |
| Events in quadrant D | 612,027 | 45,682 |
| Mode M0 | |||
|---|---|---|---|
| Quadrant | BADHDUFLAG | Total packets | Discarded packets |
| A | 0 | 1654 | 0 |
| B | 0 | 1131 | 0 |
| C | 0 | 1108 | 0 |
| D | 0 | 2209 | 1 |
| Mode SS | |||
|---|---|---|---|
| Quadrant | BADHDUFLAG | Total packets | Discarded packets |
| A | 0 | 12 | 0 |
| B | 0 | 12 | 0 |
| C | 0 | 12 | 0 |
| D | 0 | 12 | 0 |
| Quadrant | Total seconds | Saturated seconds | Saturation percentage |
|---|---|---|---|
| A | 555 | 0 | 0.000000% |
| B | 555 | 1 | 0.180180% |
| C | 555 | 0 | 0.000000% |
| D | 554 | 76 | 13.718412% |
Noise dominated data is calculated using 1-second bins in cleaned event files. If a bin has >2000 counts, and if more than 50% of those come from <1% of pixels, then it is considered to be noise-dominated and hence unusable.
| Quadrant | # 1 sec bins | Bins with >0 counts | Bins with >2000 counts | High rate bins dominated by noise | Noise dominated (total time) | Noise dominated (detector-on time) | Marked lightcurve |
|---|---|---|---|---|---|---|---|
| A | 555 | 555 | 0 | 0 | 0.00% | 0.00% | 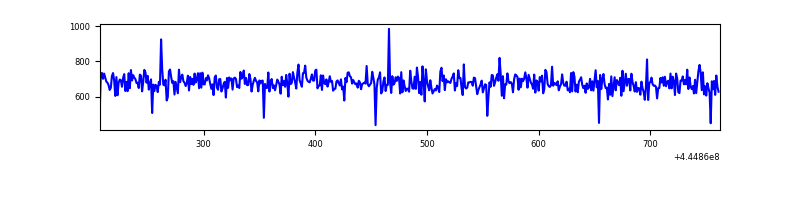 |
| B | 555 | 555 | 0 | 0 | 0.00% | 0.00% | 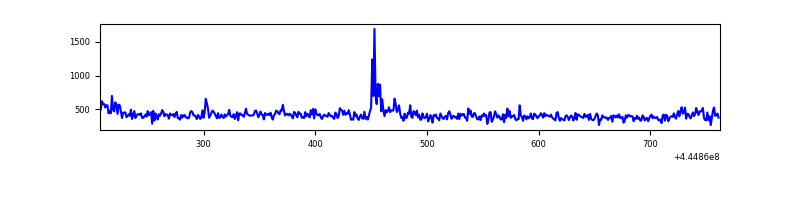 |
| C | 555 | 555 | 0 | 0 | 0.00% | 0.00% | 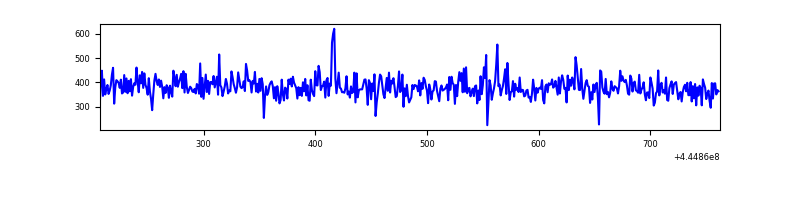 |
| D | 554 | 554 | 83 | 83 | 14.98% | 14.98% | 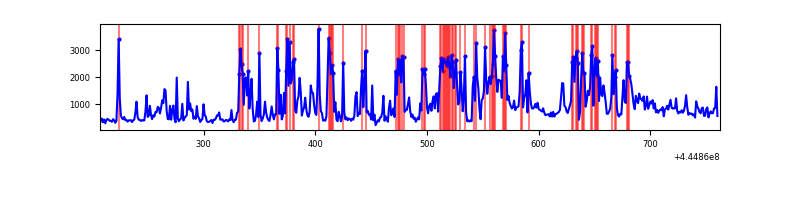 |
Top three noisy pixels from each quadrant. If the there are fewer than three noisy pixels in the level2.evt file, extra rows are filled as -1
| Pixel properties | Quadrant properties | ||||||
|---|---|---|---|---|---|---|---|
| Quadrant | DetID | PixID | Counts | Sigma | Mean | Median | Sigma |
| A | 10 | 83 | 165819 | 12457.6 | 53 | 52 | 13.3 |
| A | 13 | 254 | 779 | 54.63 | 53 | 52 | 13.3 |
| A | 0 | 243 | 653 | 45.17 | 53 | 52 | 13.3 |
| B | 4 | 170 | 15267 | 1183.19 | 54 | 53 | 12.9 |
| B | 3 | 112 | 3806 | 291.87 | 54 | 53 | 12.9 |
| B | 12 | 111 | 1396 | 104.44 | 54 | 53 | 12.9 |
| C | 3 | 233 | 2920 | 196.36 | 53 | 53 | 14.6 |
| C | 14 | 67 | 708 | 44.86 | 53 | 53 | 14.6 |
| C | 15 | 175 | 538 | 33.22 | 53 | 53 | 14.6 |
| D | 13 | 249 | 218413 | 14952.19 | 49 | 47 | 14.6 |
| D | 1 | 47 | 96540 | 6607.17 | 49 | 47 | 14.6 |
| D | 4 | 221 | 52469 | 3589.49 | 49 | 47 | 14.6 |
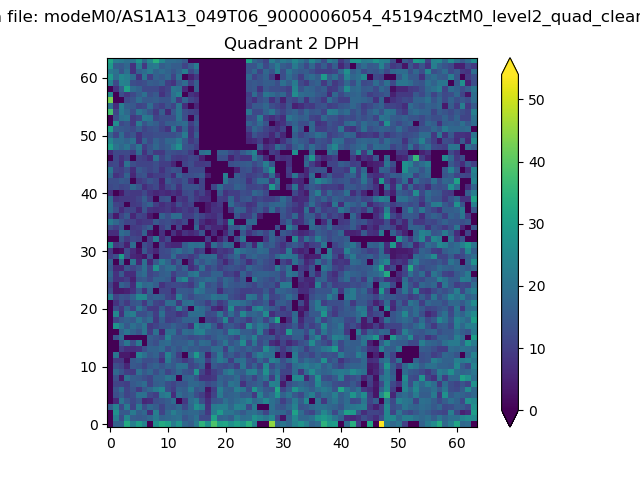
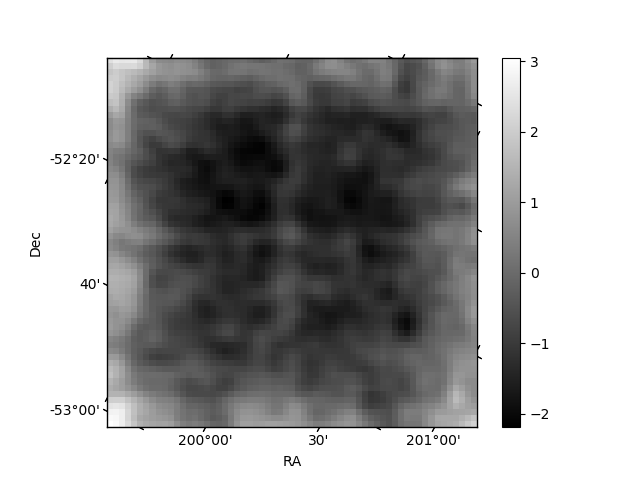
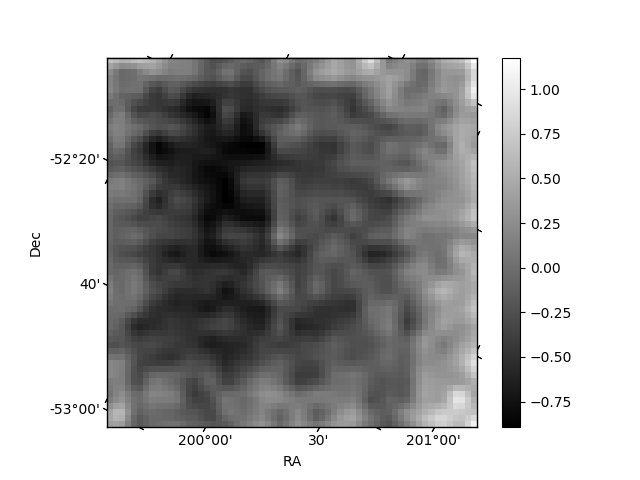
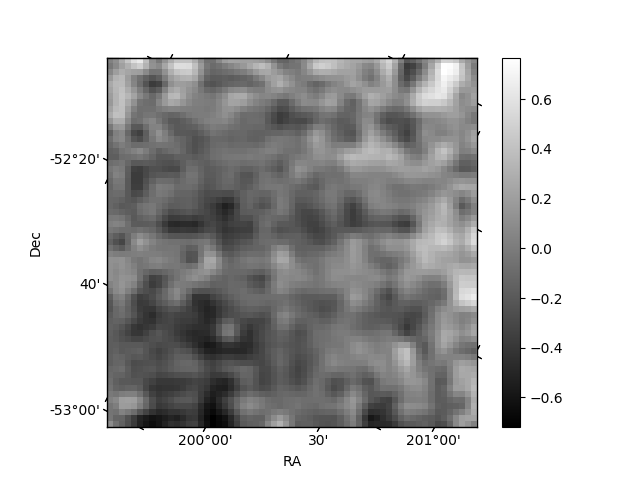
Histogram calculated using DETX and DETY for each event in the final _common_clean file
| Quadrant A | 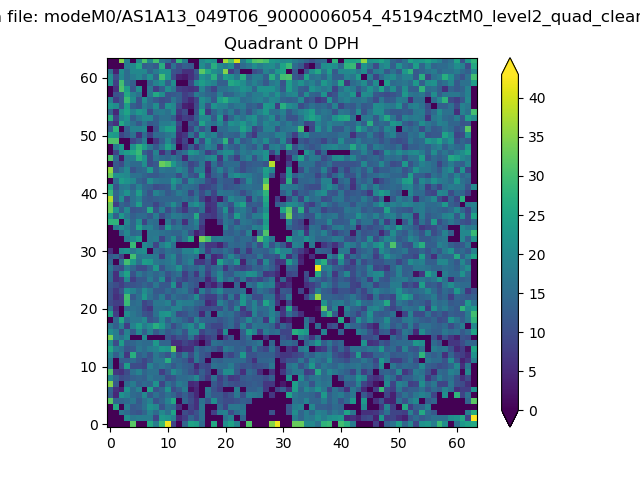 |
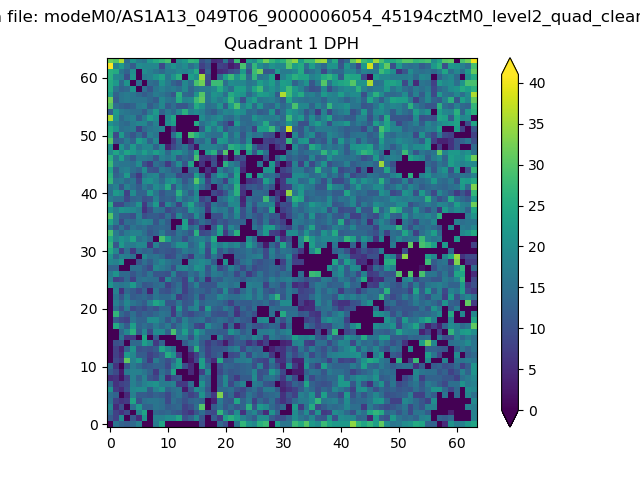 |
Quadrant B |
|---|---|---|---|
| Quadrant D | 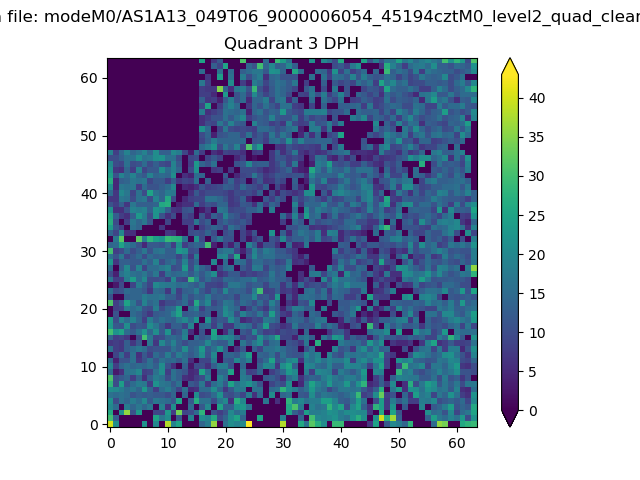 |
 |
Quadrant C |
| Plot type | Count rate plots | Images |
|---|---|---|
| Comparison with Poisson distribution Blue bars denote a histogram of data divided into 1 sec bins. Red curve is a Poisson curve with rate = median count rate of data. |
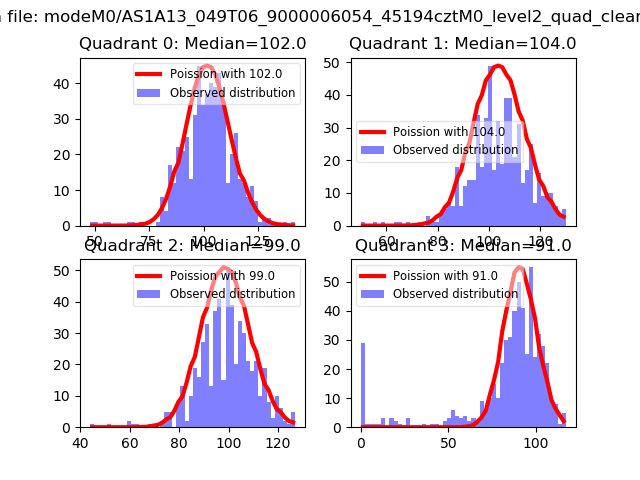 |
 |
| Quadrant-wise count rates Data is divided into 100 sec bins |
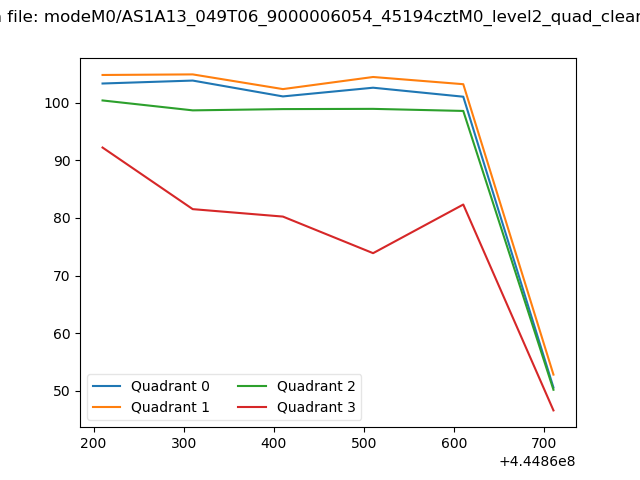 |
|
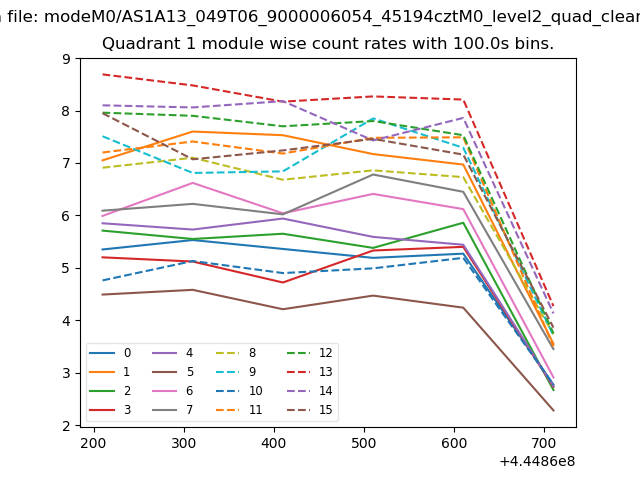
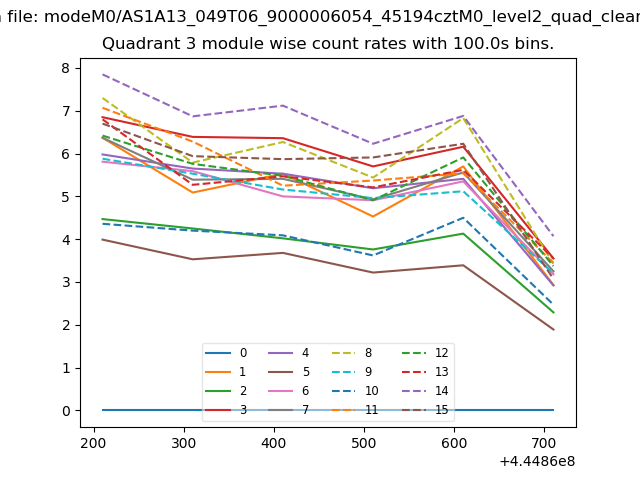
| Module-wise count rates for Quadrant A Data is divided into 100 sec bins |
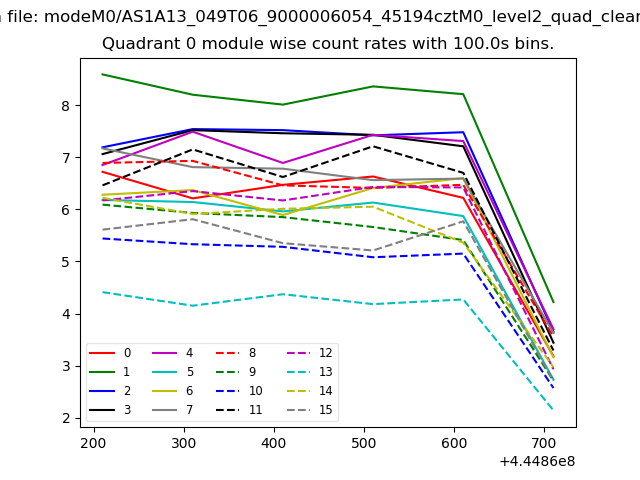 |
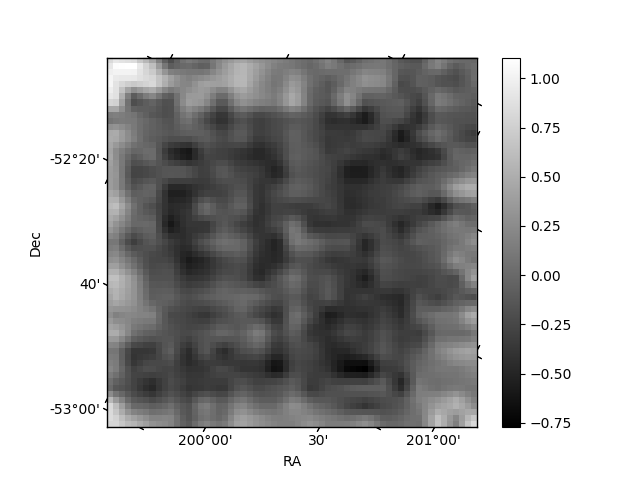 |
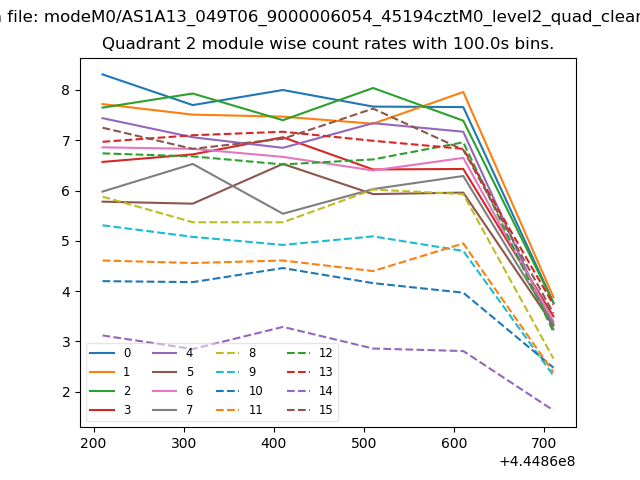
| Module-wise count rates for Quadrant B Data is divided into 100 sec bins |
 |
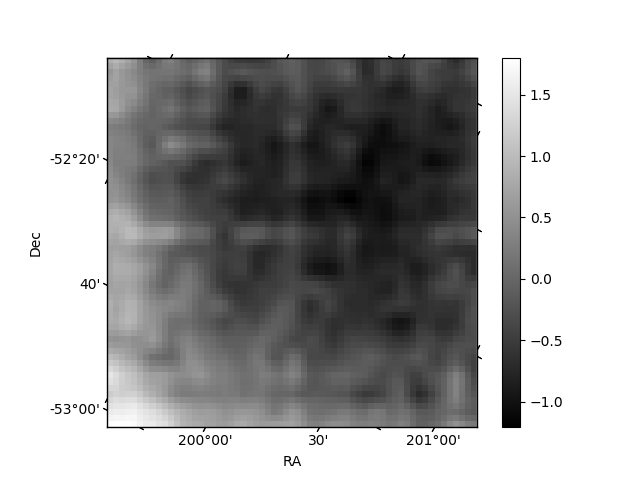 |
| Module-wise count rates for Quadrant C Data is divided into 100 sec bins |
 |
 |
| Module-wise count rates for Quadrant D Data is divided into 100 sec bins |
 |
 |
| Parameter | Plot |
|---|---|
| CZT HV Monitor |  |
| D_VDD | 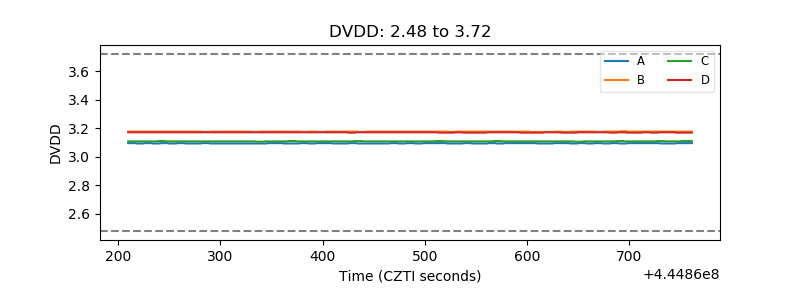 |
| Temperature 1 | 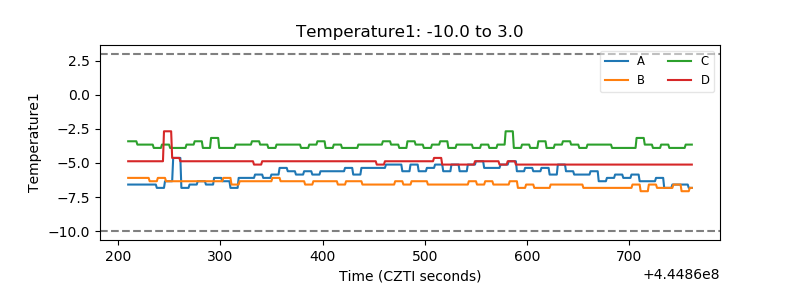 |
| Veto HV Monitor | 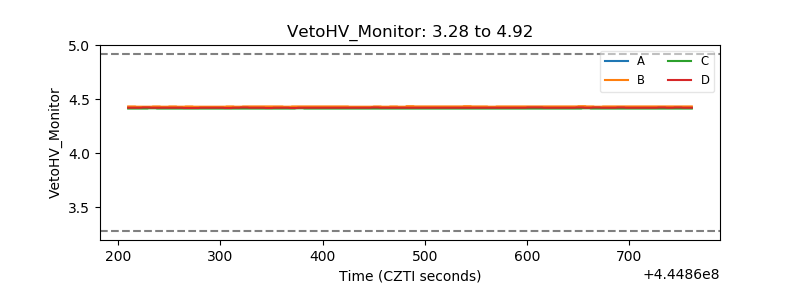 |
| Veto LLD | 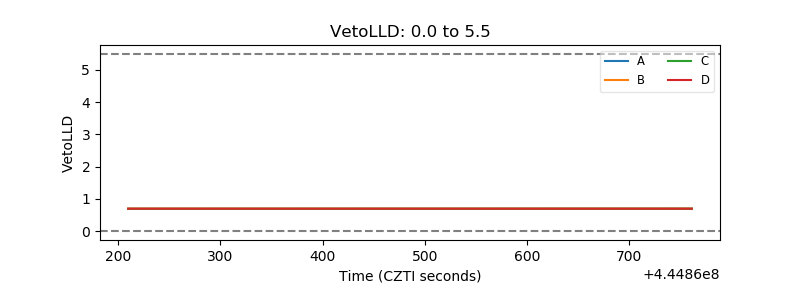 |
| Alpha Counter | 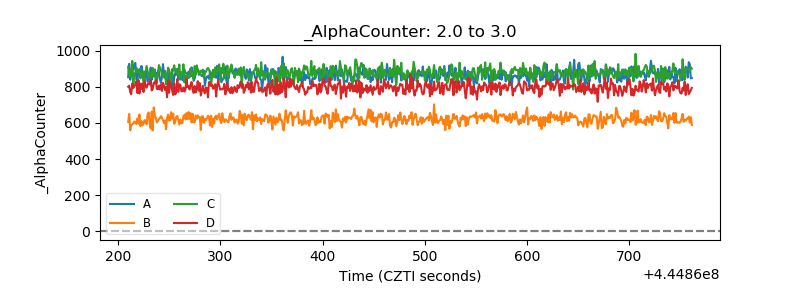 |
| _CPM_Rate | 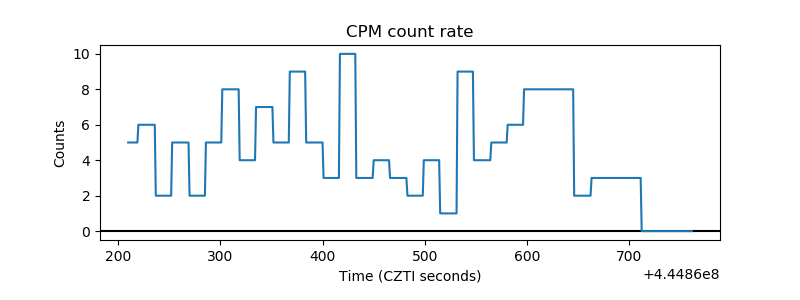 |
| CZT Counter | 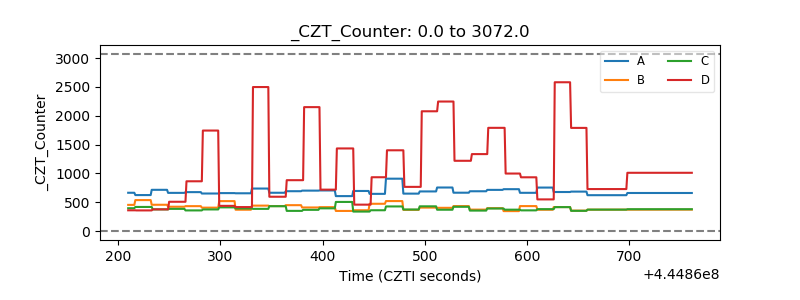 |
| +2.5 Volts monitor | 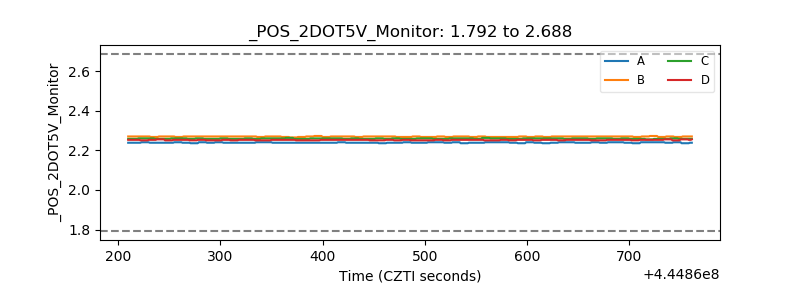 |
| +5 Volts monitor | 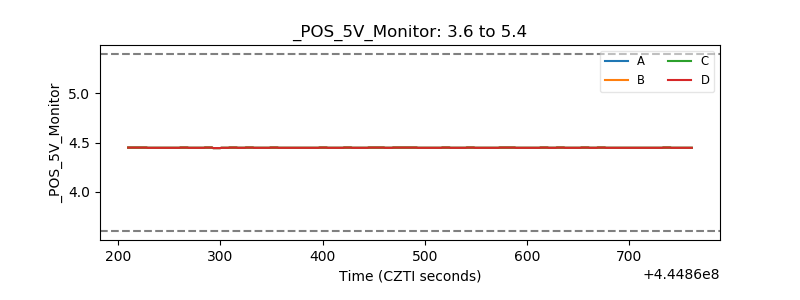 |
| _ROLL_ROT | 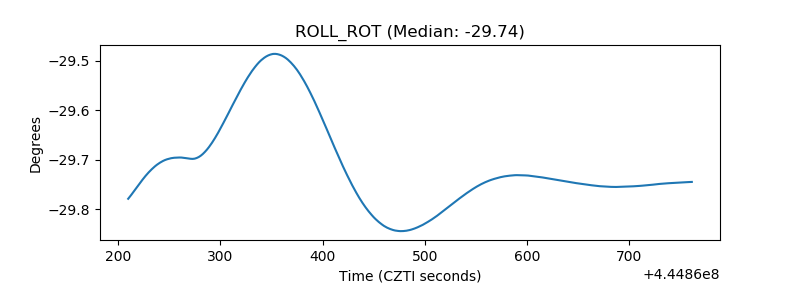 |
| _Roll_DEC | 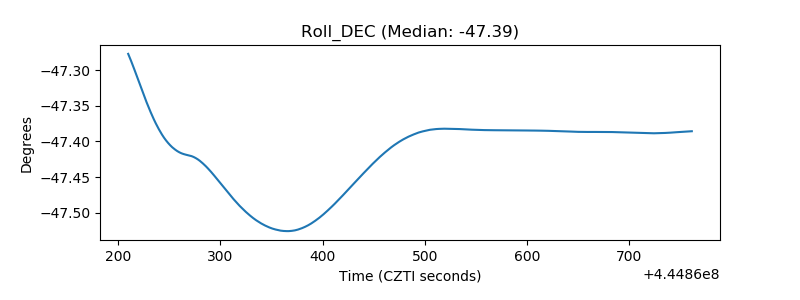 |
| _Roll_RA | 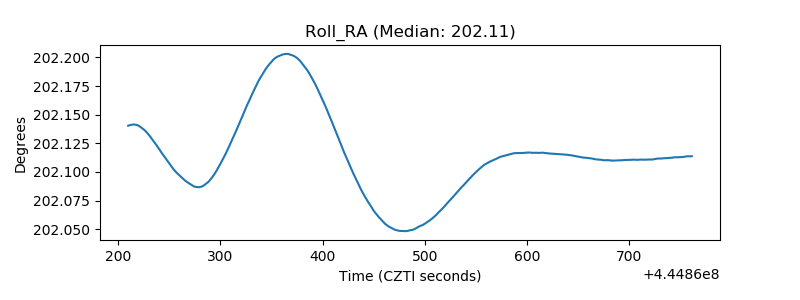 |
| Veto Counter | 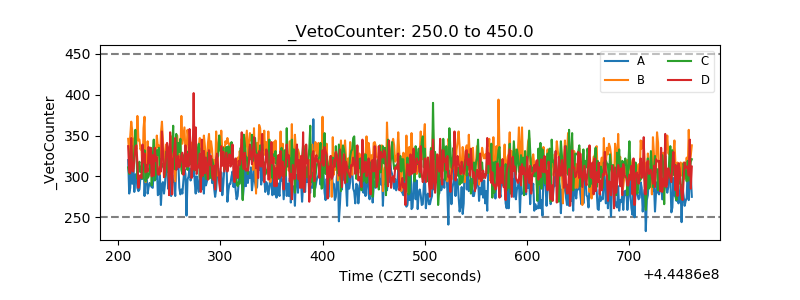 |