| Param | Original file | Final file |
|---|---|---|
| Filename | modeM0/AS1C09_004T08_9000006514_54252cztM0_level2.fits | modeM0/AS1C09_004T08_9000006514_54252cztM0_level2_quad_clean.evt |
| Size (bytes) | 732,041,280 | 76,155,840 |
| Size | 698.1 MB | 72.6 MB |
| Events in quadrant A | 7,116,871 | 485,640 |
| Events in quadrant B | 3,597,985 | 646,210 |
| Events in quadrant C | 6,200,377 | 473,189 |
| Events in quadrant D | 9,684,002 | 253,006 |
| Mode M0 | |||
|---|---|---|---|
| Quadrant | BADHDUFLAG | Total packets | Discarded packets |
| A | 0 | 25714 | 1 |
| B | 0 | 14957 | 1 |
| C | 0 | 23046 | 1 |
| D | 0 | 33159 | 2 |
| Mode M9 | |||
|---|---|---|---|
| Quadrant | BADHDUFLAG | Total packets | Discarded packets |
| A | 0 | 10 | 0 |
| B | 0 | 10 | 0 |
| C | 0 | 10 | 0 |
| D | 0 | 10 | 0 |
| Mode SS | |||
|---|---|---|---|
| Quadrant | BADHDUFLAG | Total packets | Discarded packets |
| A | 0 | 130 | 0 |
| B | 0 | 130 | 0 |
| C | 0 | 130 | 0 |
| D | 0 | 130 | 0 |
| Quadrant | Total seconds | Saturated seconds | Saturation percentage |
|---|---|---|---|
| A | 6416 | 1379 | 21.493142% |
| B | 6416 | 151 | 2.353491% |
| C | 6416 | 1222 | 19.046135% |
| D | 6415 | 3681 | 57.381138% |
Noise dominated data is calculated using 1-second bins in cleaned event files. If a bin has >2000 counts, and if more than 50% of those come from <1% of pixels, then it is considered to be noise-dominated and hence unusable.
| Quadrant | # 1 sec bins | Bins with >0 counts | Bins with >2000 counts | High rate bins dominated by noise | Noise dominated (total time) | Noise dominated (detector-on time) | Marked lightcurve |
|---|---|---|---|---|---|---|---|
| A | 7446 | 6416 | 1162 | 1162 | 15.61% | 18.11% | 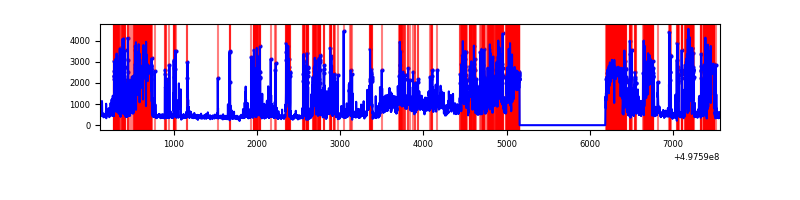 |
| B | 7446 | 6417 | 91 | 91 | 1.22% | 1.42% | 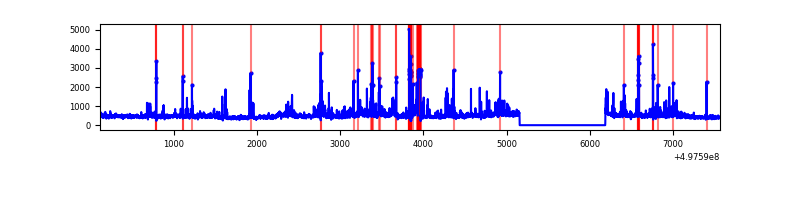 |
| C | 7446 | 6417 | 1123 | 1123 | 15.08% | 17.50% | 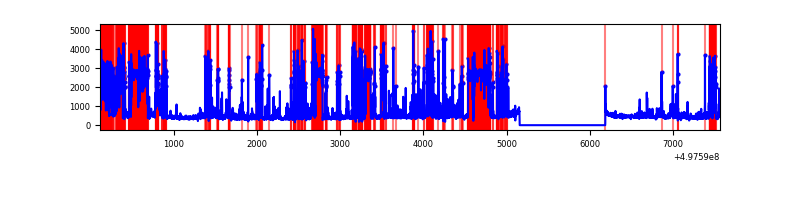 |
| D | 7445 | 6416 | 2301 | 2301 | 30.91% | 35.86% | 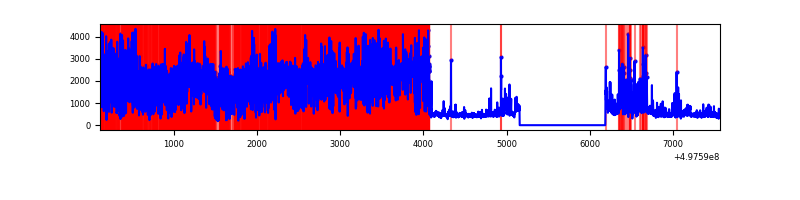 |
Top three noisy pixels from each quadrant. If the there are fewer than three noisy pixels in the level2.evt file, extra rows are filled as -1
| Pixel properties | Quadrant properties | ||||||
|---|---|---|---|---|---|---|---|
| Quadrant | DetID | PixID | Counts | Sigma | Mean | Median | Sigma |
| A | 7 | 29 | 3969062 | 27201.78 | 586 | 571 | 145.9 |
| A | 13 | 248 | 677529 | 4640.17 | 586 | 571 | 145.9 |
| A | 15 | 174 | 37192 | 251.02 | 586 | 571 | 145.9 |
| B | 0 | 213 | 368352 | 2592.97 | 661 | 639 | 141.8 |
| B | 7 | 0 | 312442 | 2198.71 | 661 | 639 | 141.8 |
| B | 8 | 234 | 92402 | 647.08 | 661 | 639 | 141.8 |
| C | 1 | 241 | 3195998 | 20044.47 | 579 | 574 | 159.4 |
| C | 14 | 254 | 305502 | 1912.77 | 579 | 574 | 159.4 |
| C | 1 | 29 | 246274 | 1541.24 | 579 | 574 | 159.4 |
| D | 8 | 176 | 7628685 | 70318.14 | 376 | 359 | 108.5 |
| D | 13 | 170 | 184425 | 1696.73 | 376 | 359 | 108.5 |
| D | 12 | 3 | 164878 | 1516.54 | 376 | 359 | 108.5 |
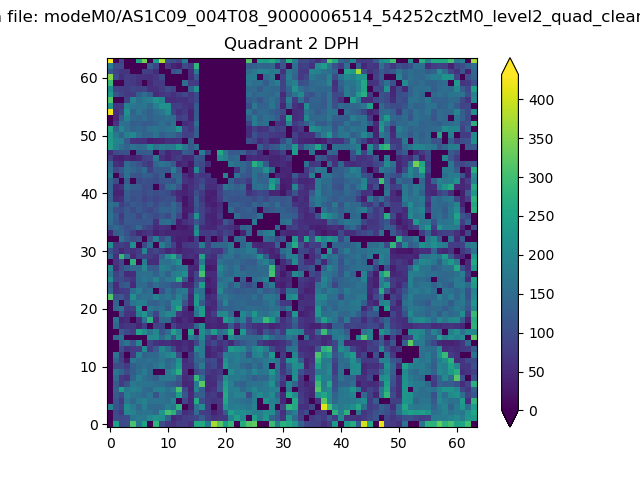
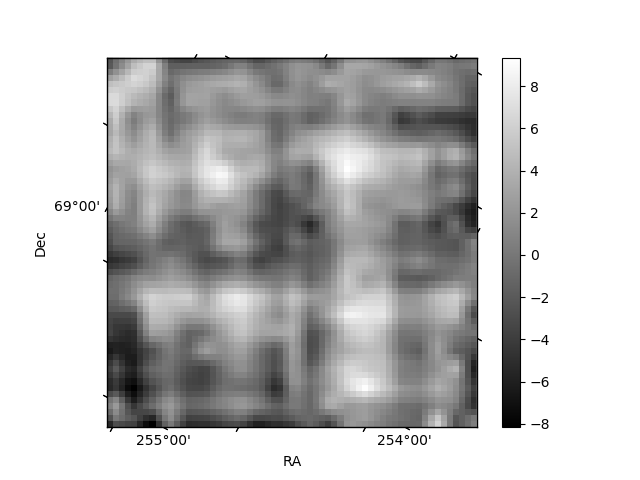
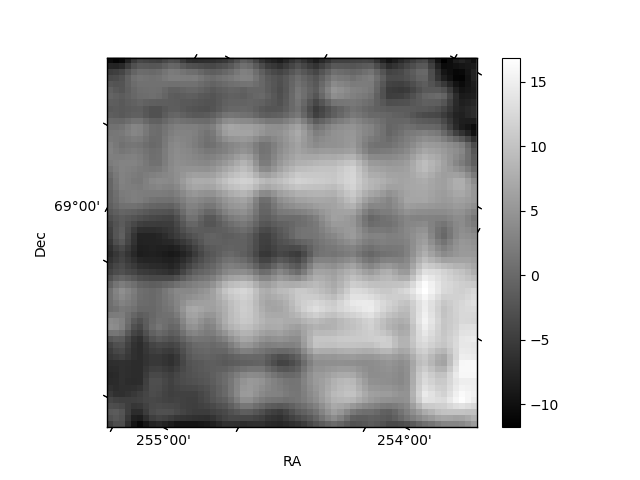
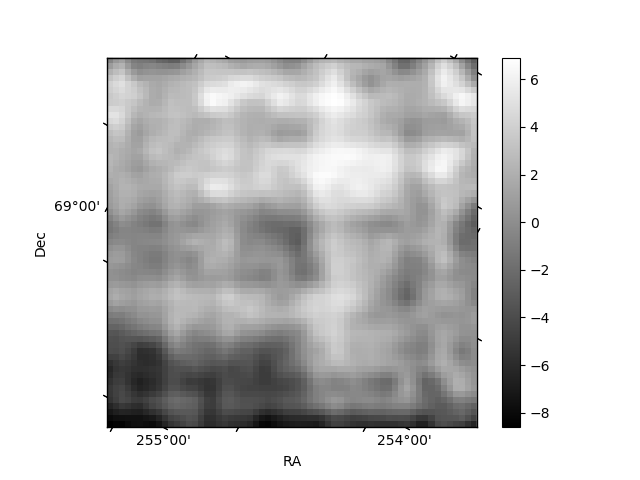
Histogram calculated using DETX and DETY for each event in the final _common_clean file
| Quadrant A |  |
 |
Quadrant B |
|---|---|---|---|
| Quadrant D | 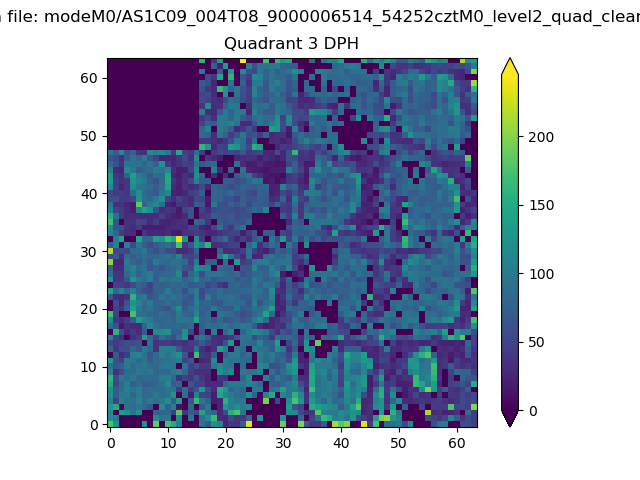 |
 |
Quadrant C |
| Plot type | Count rate plots | Images |
|---|---|---|
| Comparison with Poisson distribution Blue bars denote a histogram of data divided into 1 sec bins. Red curve is a Poisson curve with rate = median count rate of data. |
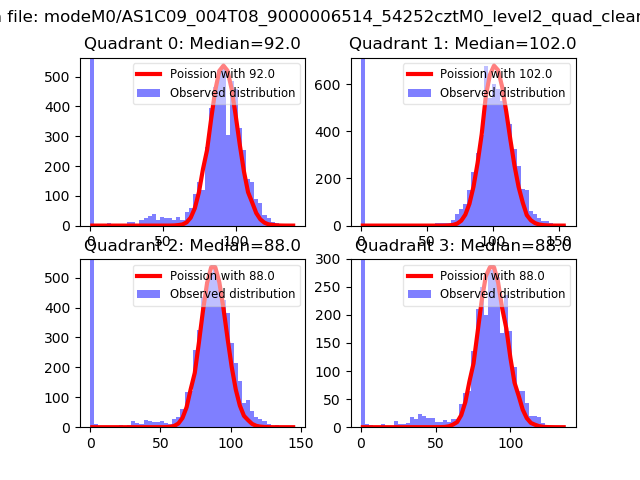 |
 |
| Quadrant-wise count rates Data is divided into 100 sec bins |
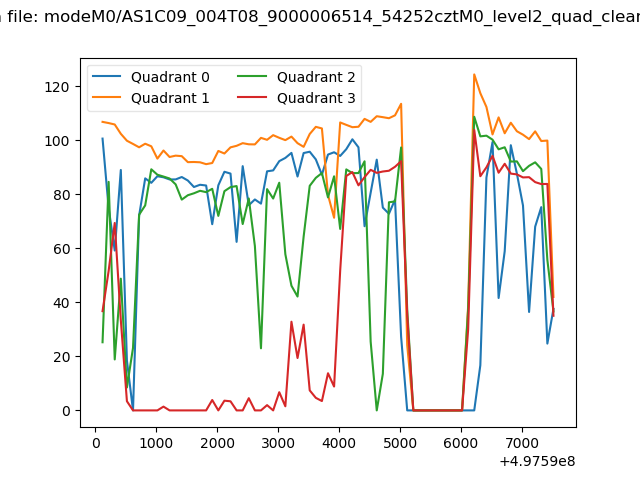 |
|
| Module-wise count rates for Quadrant A Data is divided into 100 sec bins |
 |
 |
| Module-wise count rates for Quadrant B Data is divided into 100 sec bins |
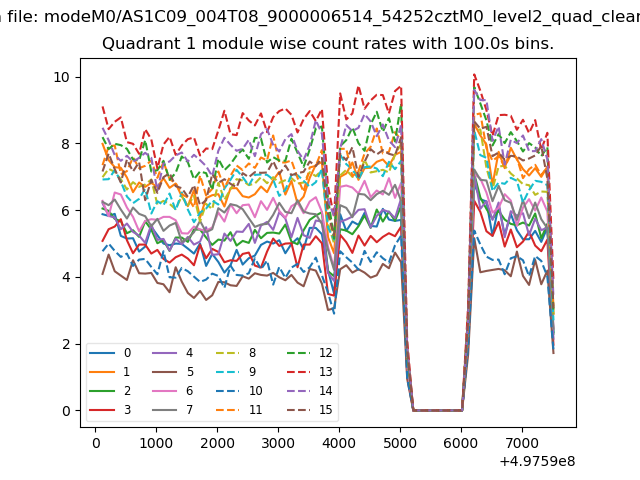 |
 |
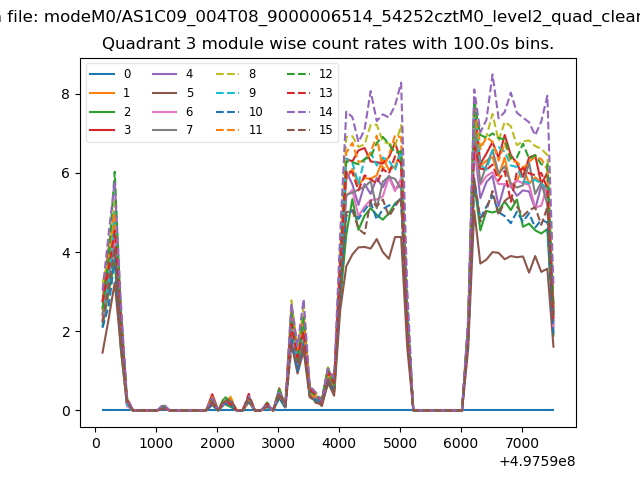
| Module-wise count rates for Quadrant C Data is divided into 100 sec bins |
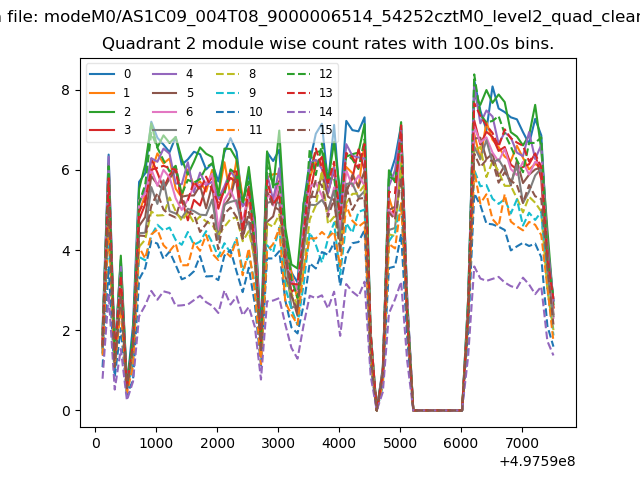 |
 |
| Module-wise count rates for Quadrant D Data is divided into 100 sec bins |
 |
 |
| Parameter | Plot |
|---|---|
| CZT HV Monitor | 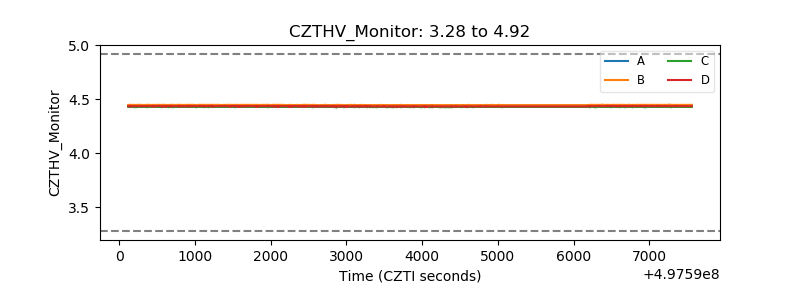 |
| D_VDD | 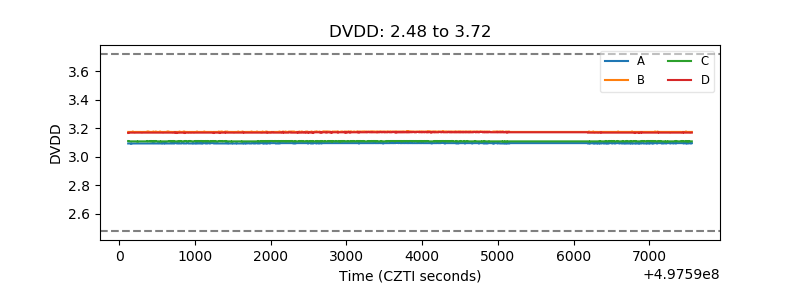 |
| Temperature 1 | 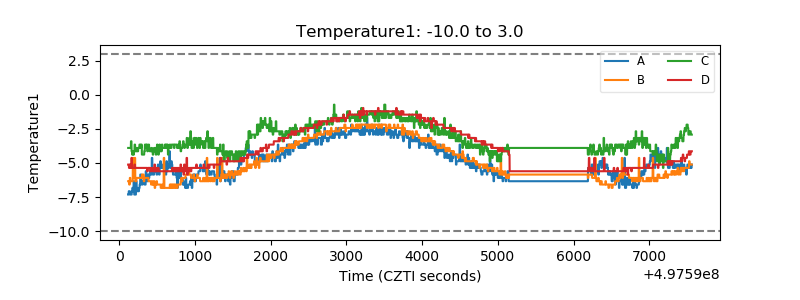 |
| Veto HV Monitor | 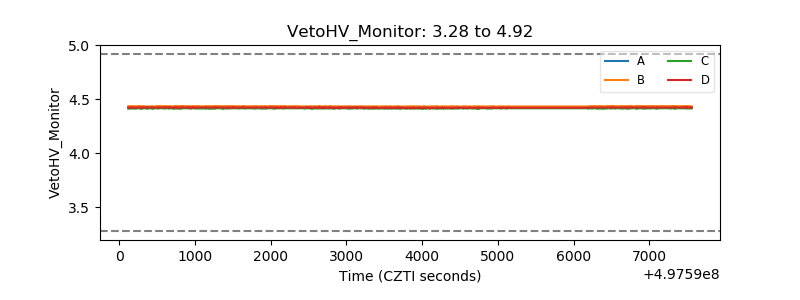 |
| Veto LLD | 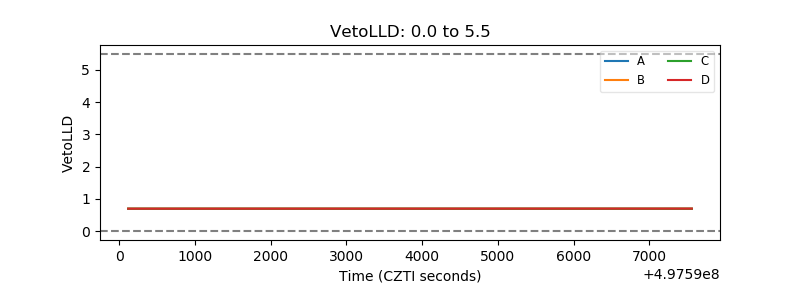 |
| Alpha Counter | 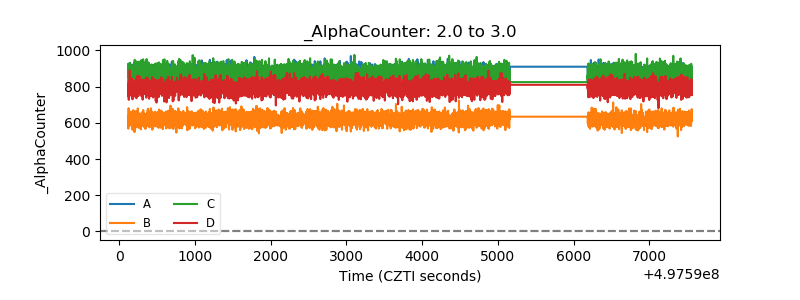 |
| _CPM_Rate | 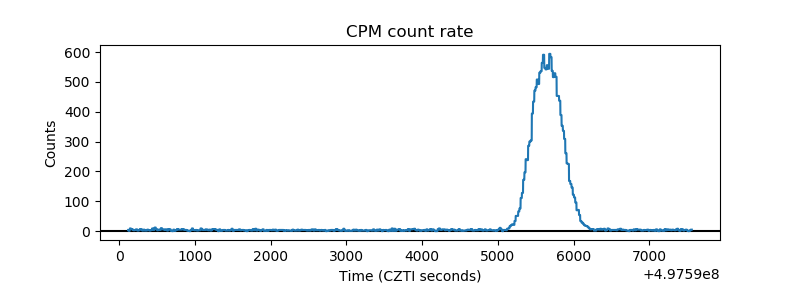 |
| CZT Counter | 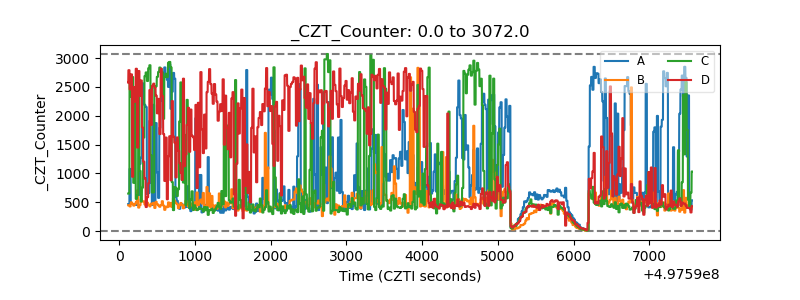 |
| +2.5 Volts monitor | 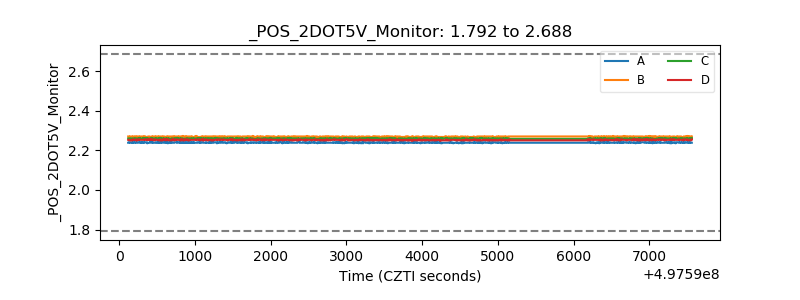 |
| +5 Volts monitor |  |
| _ROLL_ROT | 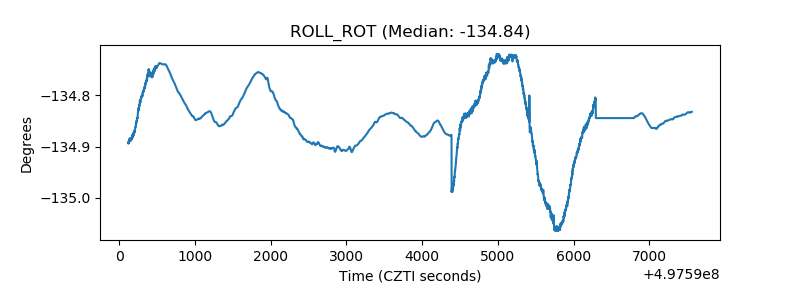 |
| _Roll_DEC | 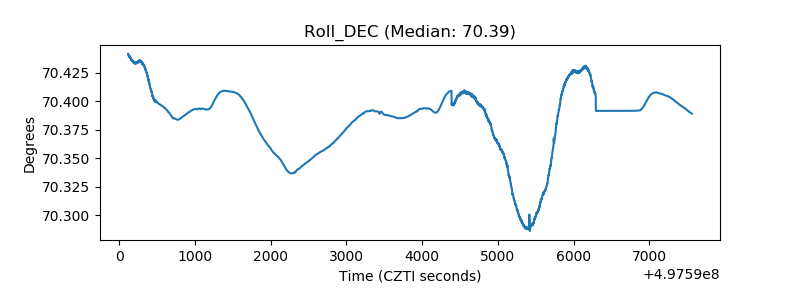 |
| _Roll_RA | 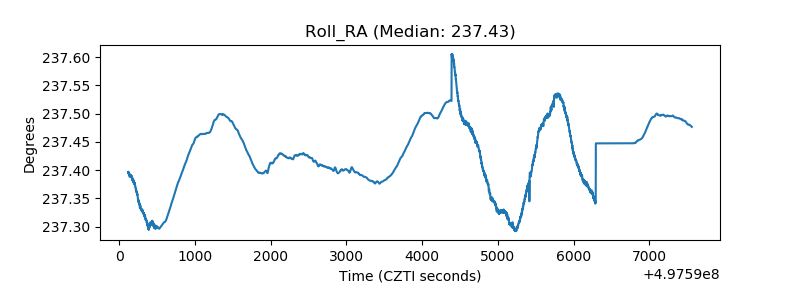 |
| Veto Counter | 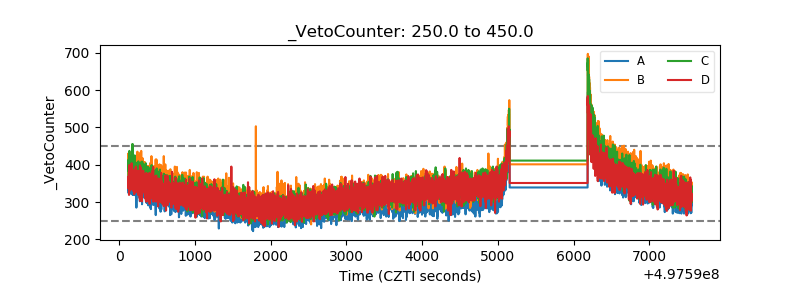 |