| Param | Original file | Final file |
|---|---|---|
| Filename | modeM0/AS1A14_083T16_9000006580_57832cztM0_level2.fits | modeM0/AS1A14_083T16_9000006580_57832cztM0_level2_quad_clean.evt |
| Size (bytes) | 26,953,920 | 5,734,080 |
| Size | 25.7 MB | 5.5 MB |
| Events in quadrant A | 199,964 | 36,847 |
| Events in quadrant B | 188,205 | 39,353 |
| Events in quadrant C | 347,818 | 32,195 |
| Events in quadrant D | 231,435 | 33,207 |
| Mode SS | |||
|---|---|---|---|
| Quadrant | BADHDUFLAG | Total packets | Discarded packets |
| A | 0 | 8 | 0 |
| B | 0 | 8 | 0 |
| C | 0 | 8 | 0 |
| D | 0 | 8 | 0 |
| Mode M0 | |||
|---|---|---|---|
| Quadrant | BADHDUFLAG | Total packets | Discarded packets |
| A | 0 | 804 | 0 |
| B | 0 | 764 | 0 |
| C | 0 | 1287 | 0 |
| D | 0 | 920 | 0 |
| Quadrant | Total seconds | Saturated seconds | Saturation percentage |
|---|---|---|---|
| A | 343 | 8 | 2.332362% |
| B | 344 | 7 | 2.034884% |
| C | 344 | 44 | 12.790698% |
| D | 344 | 6 | 1.744186% |
Noise dominated data is calculated using 1-second bins in cleaned event files. If a bin has >2000 counts, and if more than 50% of those come from <1% of pixels, then it is considered to be noise-dominated and hence unusable.
| Quadrant | # 1 sec bins | Bins with >0 counts | Bins with >2000 counts | High rate bins dominated by noise | Noise dominated (total time) | Noise dominated (detector-on time) | Marked lightcurve |
|---|---|---|---|---|---|---|---|
| A | 343 | 343 | 2 | 2 | 0.58% | 0.58% | 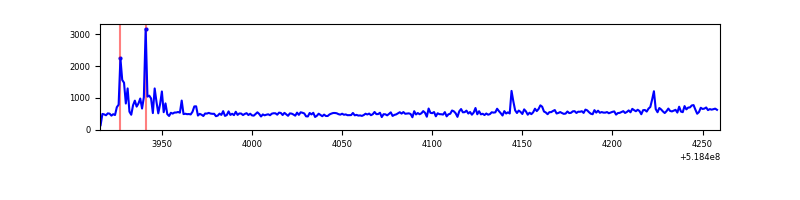 |
| B | 344 | 344 | 0 | 0 | 0.00% | 0.00% | 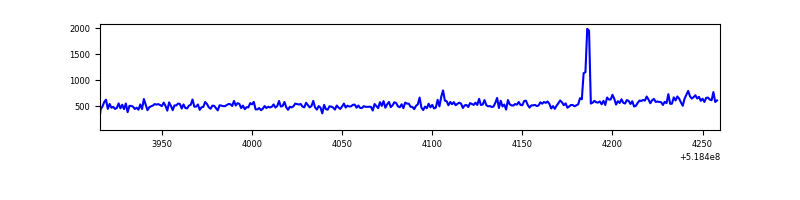 |
| C | 344 | 344 | 20 | 20 | 5.81% | 5.81% | 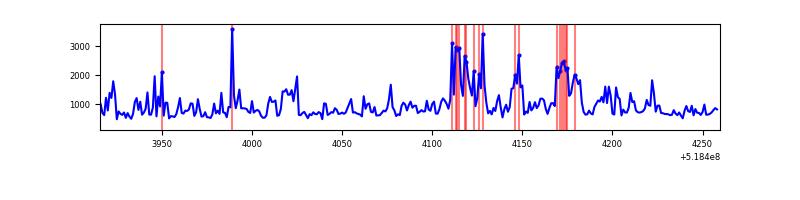 |
| D | 344 | 344 | 2 | 2 | 0.58% | 0.58% | 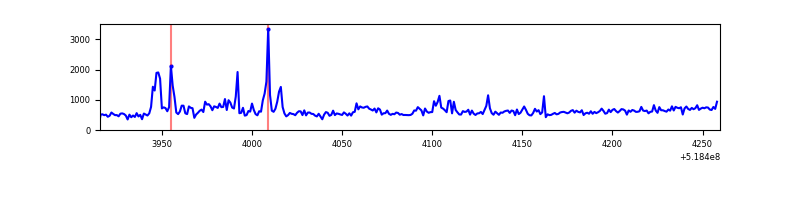 |
Top three noisy pixels from each quadrant. If the there are fewer than three noisy pixels in the level2.evt file, extra rows are filled as -1
| Pixel properties | Quadrant properties | ||||||
|---|---|---|---|---|---|---|---|
| Quadrant | DetID | PixID | Counts | Sigma | Mean | Median | Sigma |
| A | 10 | 251 | 22790 | 1796.85 | 44 | 42 | 12.7 |
| A | 3 | 128 | 4372 | 342.02 | 44 | 42 | 12.7 |
| A | 4 | 3 | 1443 | 110.66 | 44 | 42 | 12.7 |
| B | 0 | 213 | 5932 | 529.07 | 43 | 42 | 11.1 |
| B | 6 | 51 | 4631 | 412.21 | 43 | 42 | 11.1 |
| B | 0 | 63 | 2270 | 200.13 | 43 | 42 | 11.1 |
| C | 15 | 224 | 88973 | 6900.09 | 40 | 39 | 12.9 |
| C | 9 | 38 | 80027 | 6206.0 | 40 | 39 | 12.9 |
| C | 6 | 223 | 13740 | 1063.02 | 40 | 39 | 12.9 |
| D | 12 | 110 | 14495 | 1056.15 | 42 | 40 | 13.7 |
| D | 2 | 249 | 12848 | 935.81 | 42 | 40 | 13.7 |
| D | 8 | 240 | 11177 | 813.72 | 42 | 40 | 13.7 |
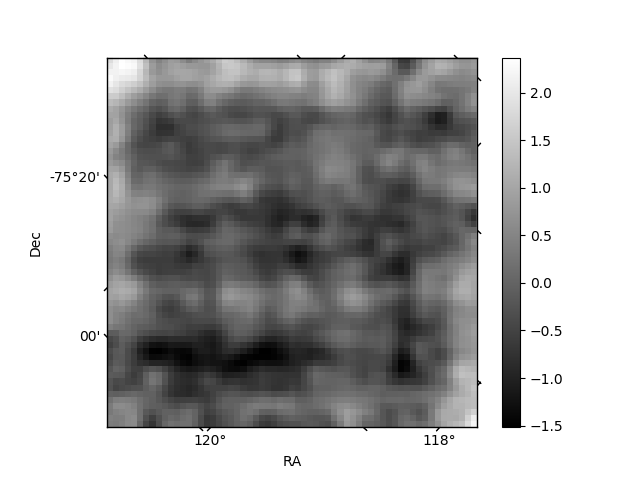
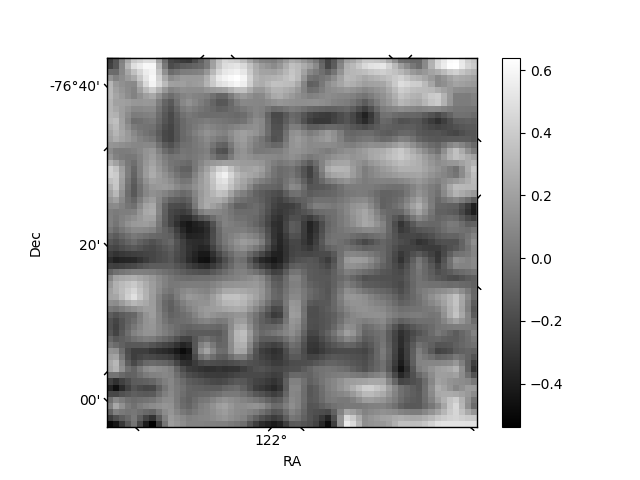
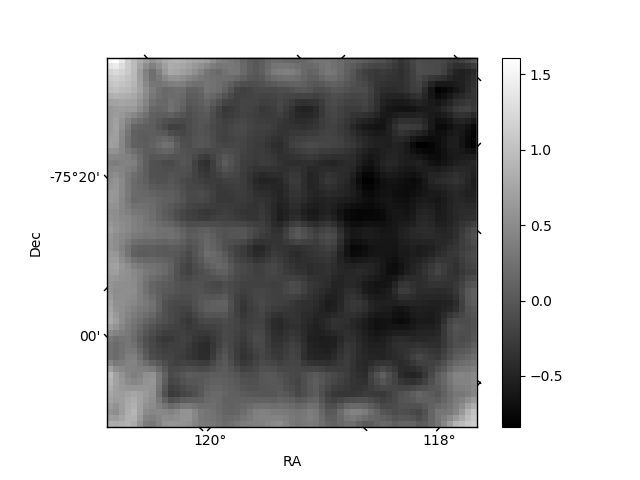
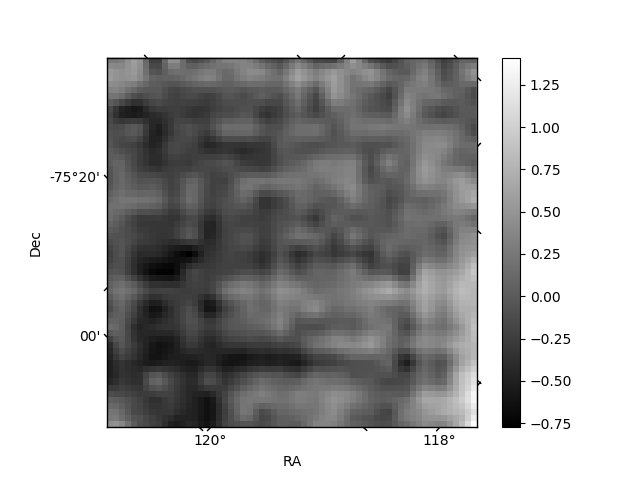
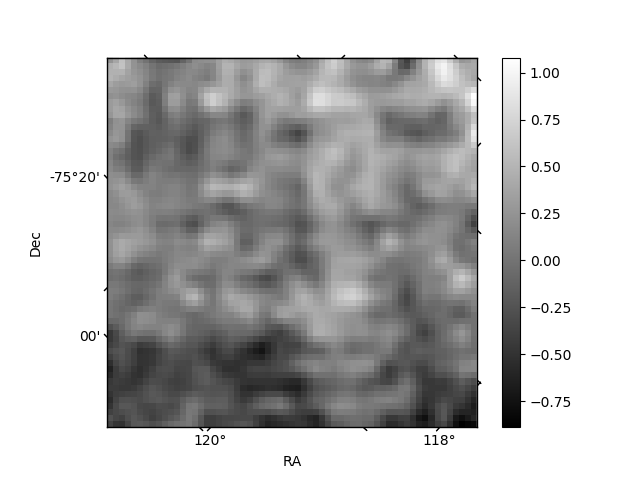
Histogram calculated using DETX and DETY for each event in the final _common_clean file
| Quadrant A | 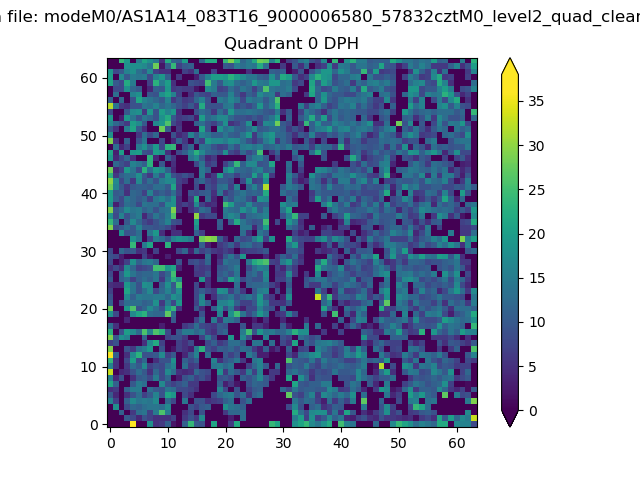 |
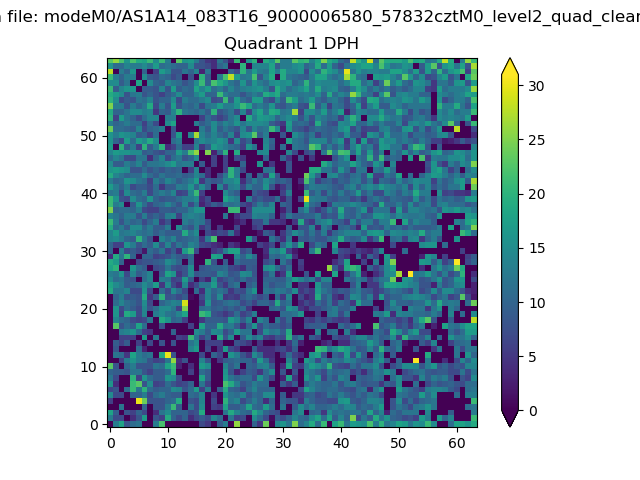 |
Quadrant B |
|---|---|---|---|
| Quadrant D | 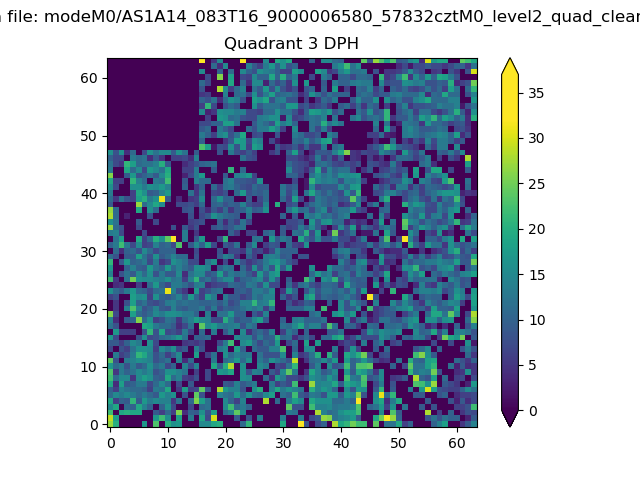 |
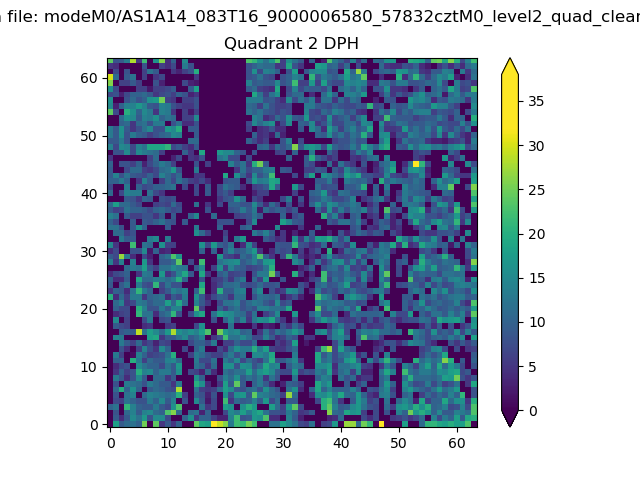 |
Quadrant C |
| Plot type | Count rate plots | Images |
|---|---|---|
| Comparison with Poisson distribution Blue bars denote a histogram of data divided into 1 sec bins. Red curve is a Poisson curve with rate = median count rate of data. |
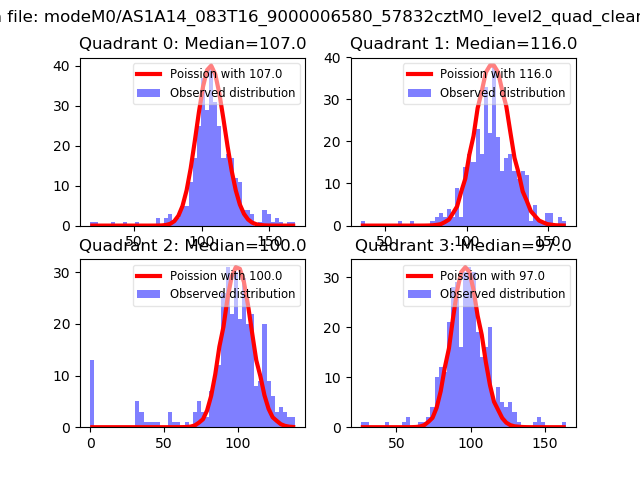 |
 |
| Quadrant-wise count rates Data is divided into 100 sec bins |
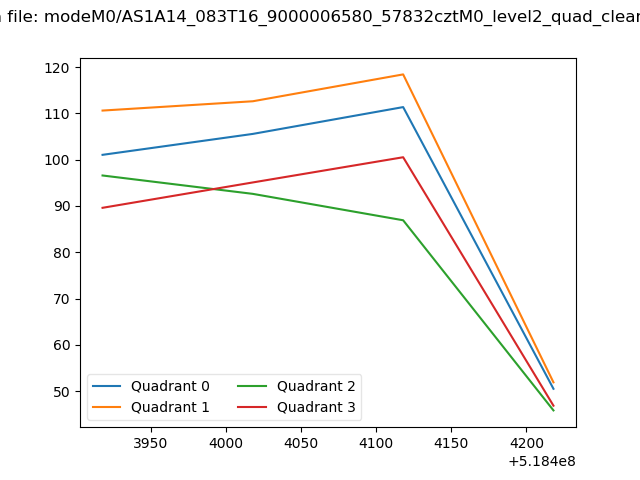 |
|
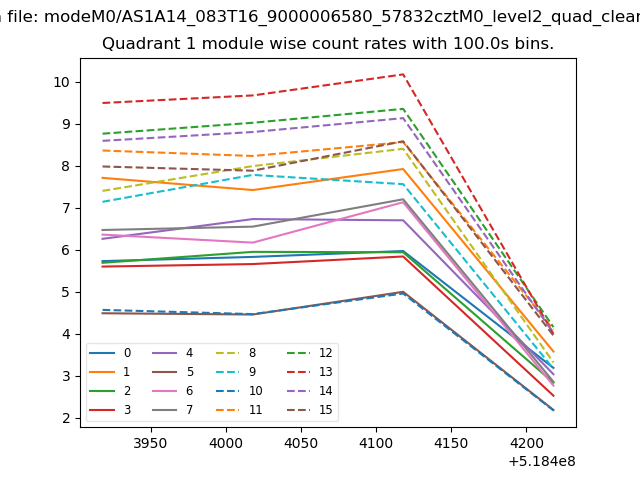
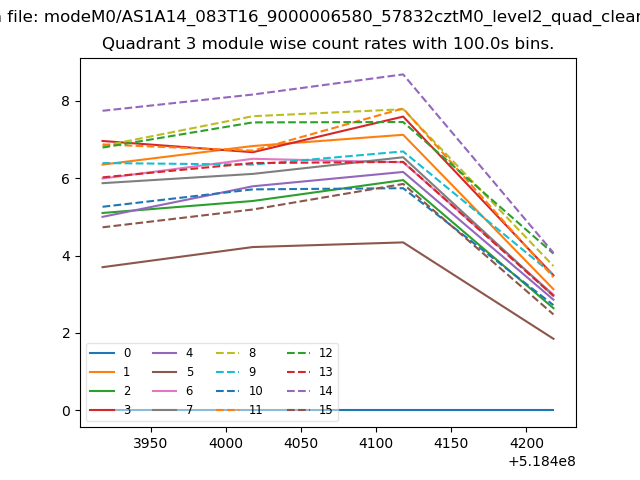
| Module-wise count rates for Quadrant A Data is divided into 100 sec bins |
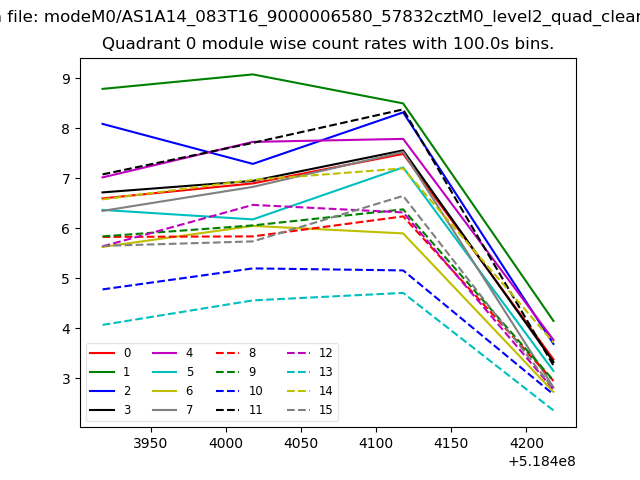 |
 |
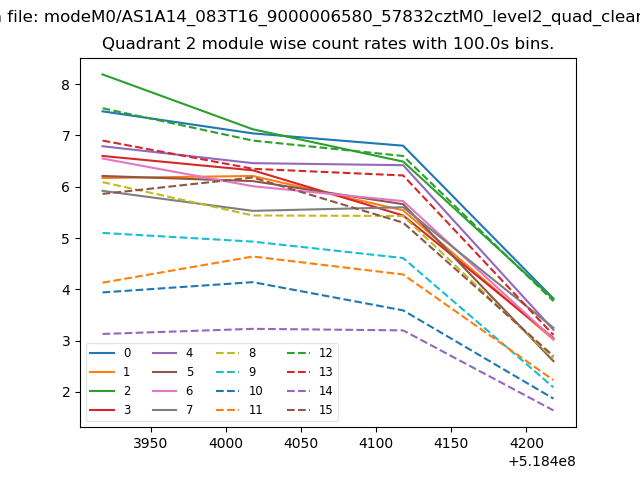
| Module-wise count rates for Quadrant B Data is divided into 100 sec bins |
 |
 |
| Module-wise count rates for Quadrant C Data is divided into 100 sec bins |
 |
 |
| Module-wise count rates for Quadrant D Data is divided into 100 sec bins |
 |
 |
| Parameter | Plot |
|---|---|
| CZT HV Monitor | 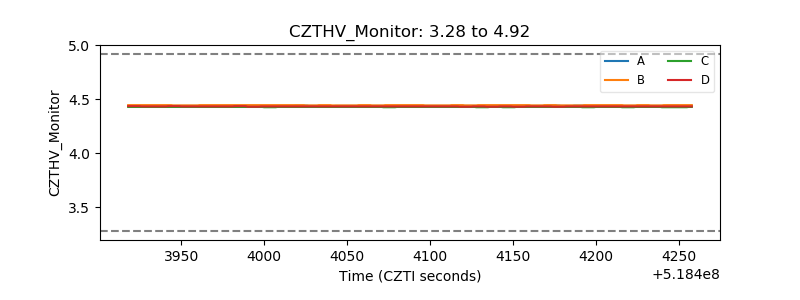 |
| D_VDD | 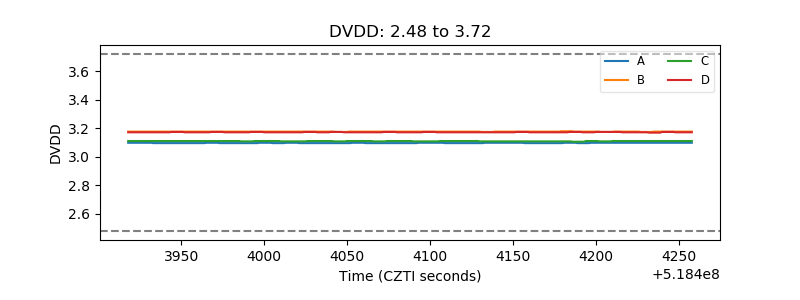 |
| Temperature 1 | 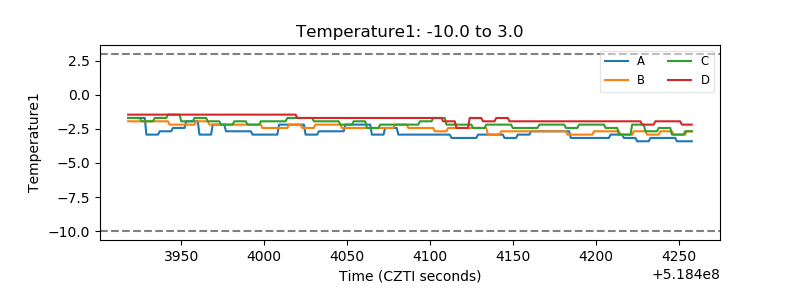 |
| Veto HV Monitor | 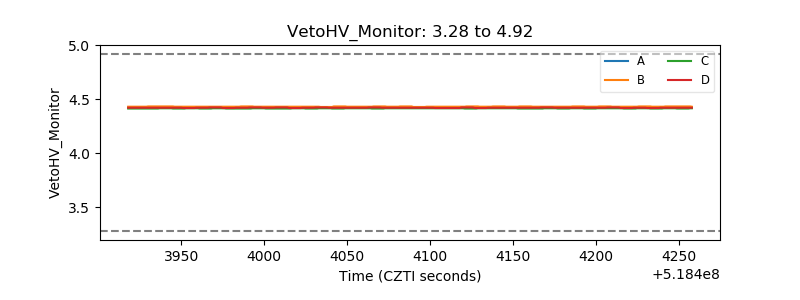 |
| Veto LLD | 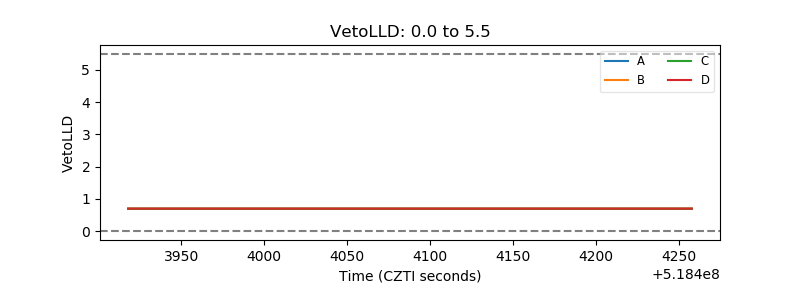 |
| Alpha Counter | 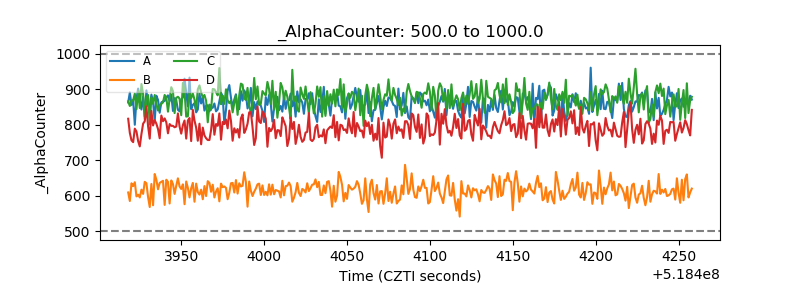 |
| _CPM_Rate | 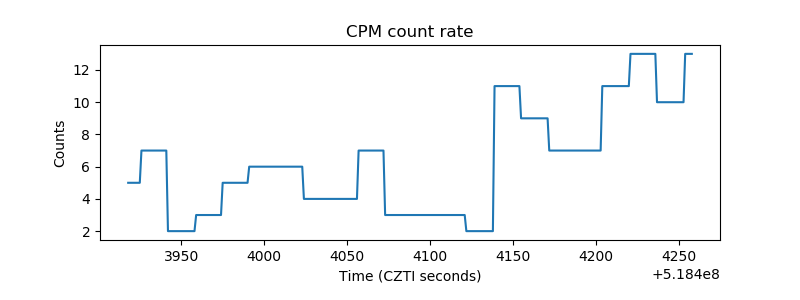 |
| CZT Counter | 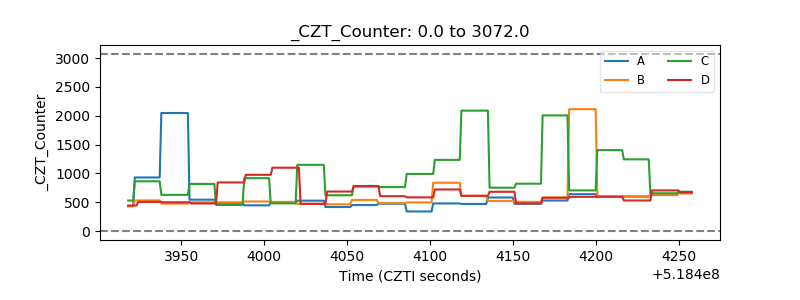 |
| +2.5 Volts monitor |  |
| +5 Volts monitor | 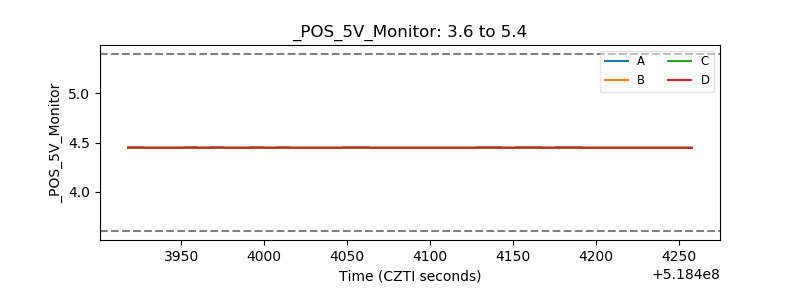 |
| _ROLL_ROT | 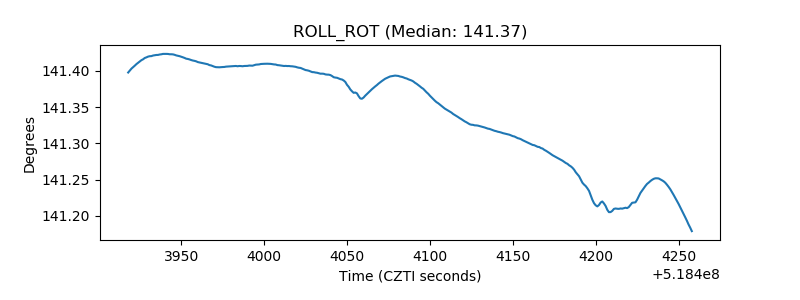 |
| _Roll_DEC | 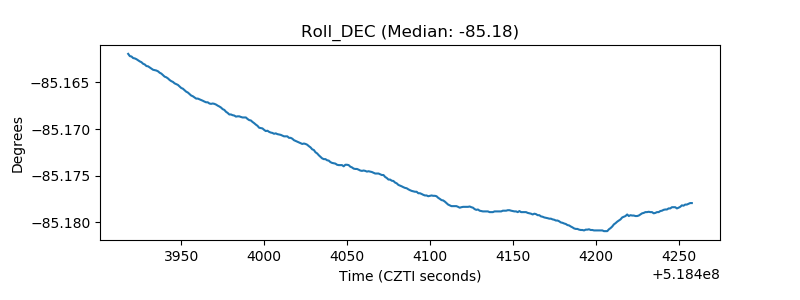 |
| _Roll_RA | 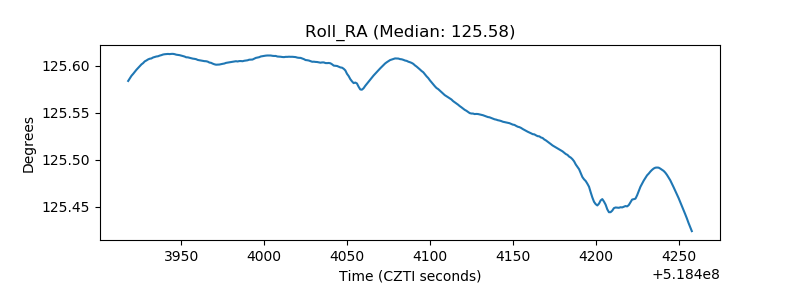 |
| Veto Counter | 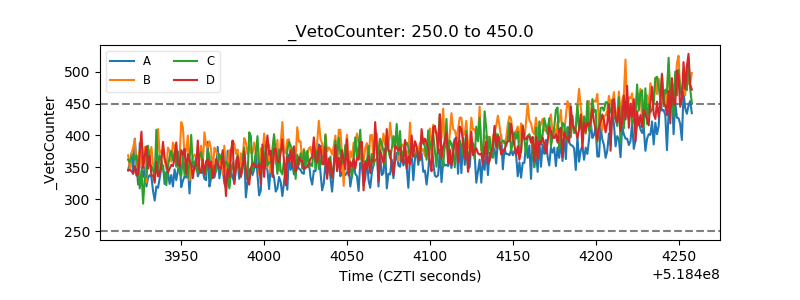 |